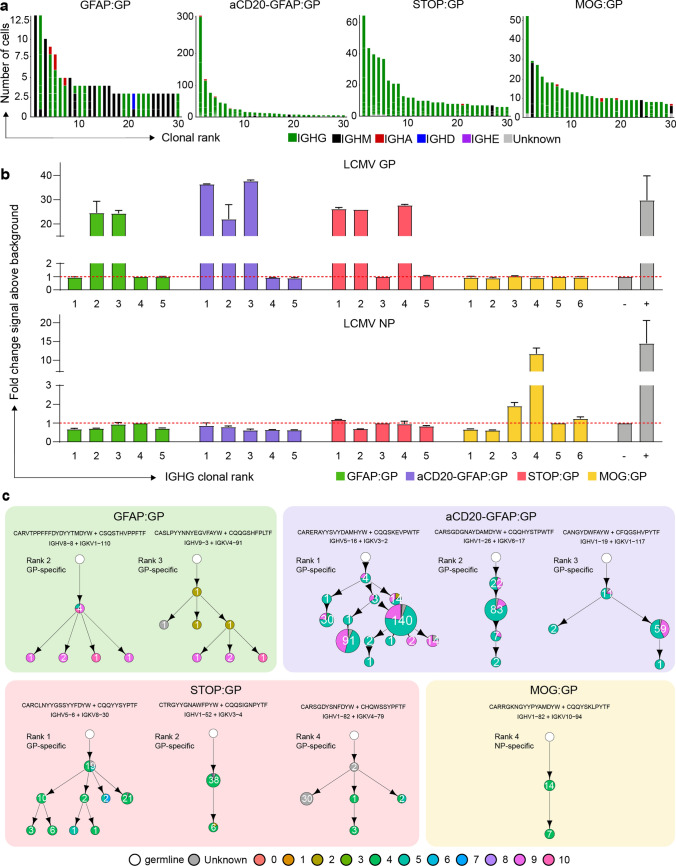
Fig. 4.
The antigen specificity of clonally expanded and class-switched ASCs of the brain. a The relationship between the number of cells per clone and the number of clonally related antibody variants within the indicated clone. The thirty most expanded clones were selected per experimental group. Clone was determined by grouping those B cells containing identical CDRH3 + CDRL3 amino acid sequences. Variants within each clone are separated by a white line. Bar color refers to the isotype corresponding to the highest fraction of cells within the variant. b ELISA signal against lymphocytic choriomeningitis virus (LCMV) glycoprotein (GP) and nucleocapsid protein (NP). Clonal rank was determined within each group based on the highest number of cells within each clonotype. c Mutational networks of those specific clones. Nodes represent unique antibody variants (combined variable heavy [VH] and variable light [VL] chain nucleotide sequence) and edges demonstrate sequences with the smallest separation calculated by edit distance. Nodes are colored by transcriptional clusters. The size and label of the nodes indicate how many cells express each full-length antibody variant. Clone was determined by grouping those B cells containing identical CDRH3 + CDRL3 amino acid sequences. Only cells containing exactly one VH and VL were considered. The germline node represents the unmutated reference sequence determined by 10X Genomics cellranger. CDR3 Sequence motifs on top of each network and corresponding V genes. Color corresponds to biophysical properties

