Fig. 7.
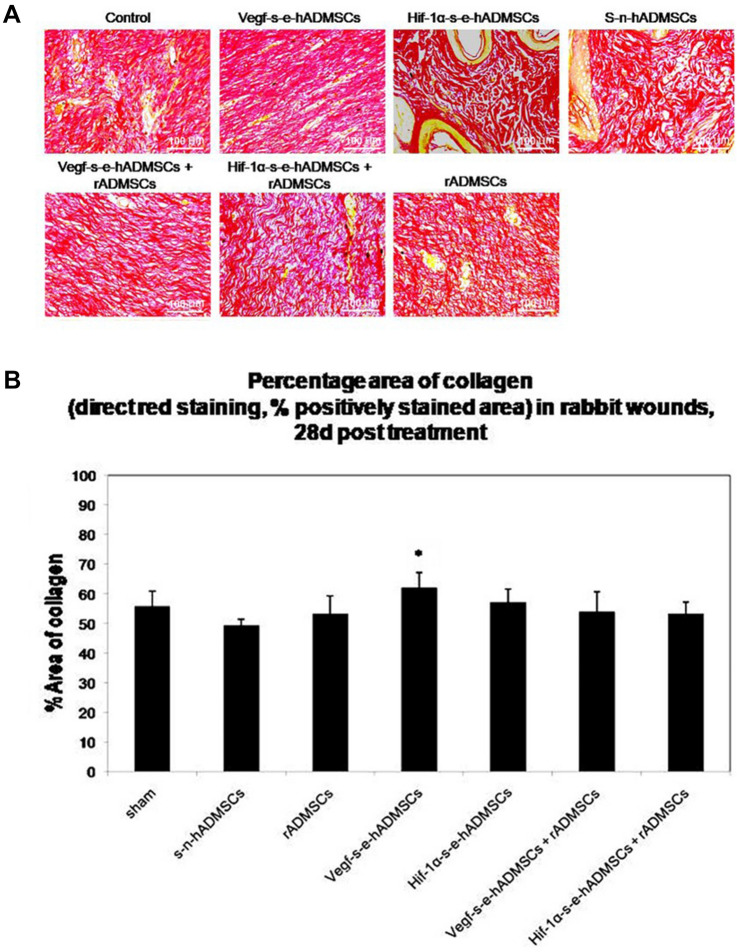
Representative images demonstrating collagen deposition. A Sirius Red stained sections depicting collagen deposition and organization in control and treated groups. Scale bar = 100 µm, (n = 3). B Comparison of percentage area of collagen: Sirius Red staining, Percentage area occupied by positively stained collagen fibers in relation to the total repair area in rabbit wounds, 28 days post treatments. Vegf-s–e-hADMSCs and Hif-1α-s–e-hADMSCs show significant effect in deposition of collagen [n = 3, Error bars represent standard deviation, ***(P < 0.001); **(P < 0.01); and *(P < 0.05) vs sham (control)]

