Fig. 3.
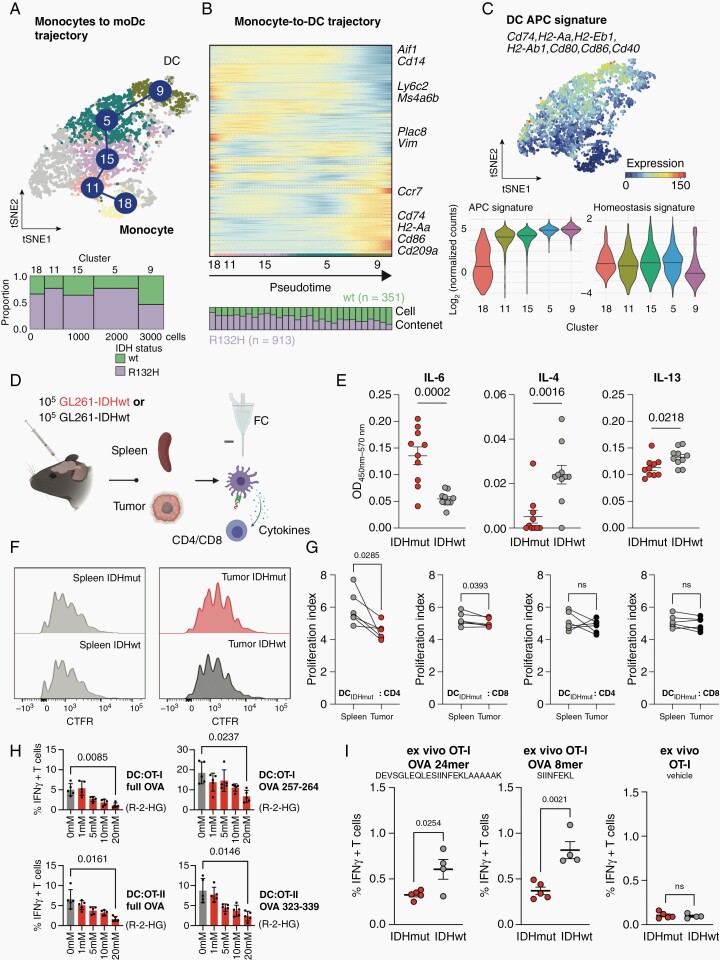
IDH status-dependent differential education of monocyte-derived dendritic cells. (A) Top: t-SNE representation of monocyte-derived macrophages and moDCs color-coded for RaceID cluster. Analysis was conducted on n = 913 cells from IDH-mutated (IDHmut) and n = 351 cells from IDH-wildtype (IDHwt) experimental HGG. Bottom: Marimekko plot of cluster-wise cellular abundance between IDHmut and IDHwt gliomas (B) Illustration of distinct trajectories from monocytes to monocyte-derived DCs. Heatmaps represent gene expression along the respective trajectory with the cell composition along each trajectory shown below (25 cells are binned for each stacked column). The StemID2 algorithm was utilized. (C) Top: Median expression of DC antigen presentation capacity (APC) signature. Marker genes of the signature indicated. Bottom: Violin plots showing cluster-wise cumulative gene expression of the APC and Homeostasis signature in cells extracted from HGG. Median and probability density smoothed by a kernel density estimator shown. (D–G) Functional ex vivo DC: T cell activation assay. (D) Experimental overview. DCs were isolated from intracranial experimental HGG and spleens by FACS and co-cultured with antigen-specific CD4 and CD8 T cells. (E) Cytokine ELISA of indicated cytokines measured in tumor interstitial fluid isolated from IDHmut and IDHwt experimental HGG at late stage (d21). OD450nm-570nm ± SEM shown for each cytokine. (F) Representative flow cytometry-based histograms of T cell proliferation via CellTrace Far Red (CFTR) staining of CD8+ T cells. (G) Quantification of differential T cell proliferation in ex vivo DC: T cell co-culture. Proliferation index calculated from CFTR-staining. P-values are derived from paired student’s t-tests. (H) Flow cytometry-based quantifications of intracellular Interferon-gamma (IFN-γ) of OT-I and OT-II T cells co-cultured with syngeneic DCs after exposure to varying concentrations of paracrine R-2-HG or vehicle. DCs were pulsed with full Ovalbumin (OVA) protein or indicated OVA peptides to elicit OT-I or OT-II restricted T cell responses. P-values are derived from paired student’s t-tests. (I) Flow cytometry-based quantifications of intracellular Interferon-gamma (IFN-γ) of OT-I T cells co-cultured with glioma-derived immune cells from IDHmut or IDHwt tumors. Co-culture was pulsed with indicated OVA 24mer or 8mer peptides to elicit OT-I T cell responses. P-values are derived from unpaired student’s t-tests.

