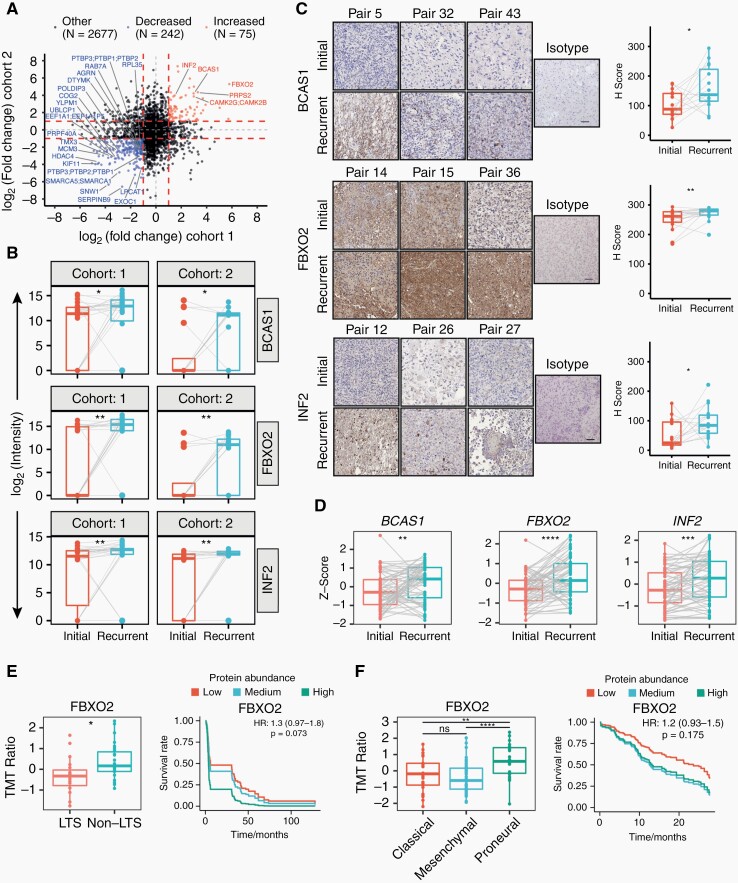
Fig. 3.
Differentially expressed proteins in matched initial-recurrent glioblastoma samples across both cohorts and external validation. (A) Scatterplot representing differential protein abundance in both cohorts. Only significantly up- (red) and downregulated (blue) proteins are labeled with names (one-sided, paired Wilcoxon rank-sum test; Ha = higher for upregulated proteins, Ha = lower for downregulated proteins). Fold change cutoffs are indicated by red dashed lines. (B) Protein abundance distributions of BCAS1, FBXO2, and INF2 in both cohorts. (C) Representative images and quantification of matched initial-recurrent glioblastoma sections stained for BCAS1 (15 sample pairs), FBXO2 (19 sample pairs), and INF2 (15 sample pairs). Scale bar = 100 µm. (D) Expression of indicated genes in external RNA sequencing data of matched initial-recurrent tumors. Significance in (C) and (D) according to a one-sided Welch test (Ha = greater at recurrence). Gray lines in B–D indicate sample pairs. (E) Association between OS and FBXO2 abundance in external proteomics data derived from long-term (LTS; OS ≥3 years) and non-long-term (non-LTS) surviving patients.24 Left: FBXO2 abundance in LTS and non-LTS patients. Right: Predicted survival based on Cox proportional hazard regression for three protein abundance quantiles (0%-33%: low; 33%-66%: medium, >66%: high). (F) Association between OS and FBXO2 in proteomics data from the CPTAC consortium.25 Left: FBXO2 protein abundance across different transcriptional subtypes. Right: Predicted survival as described in E. Statistical significances in (E) and (F) are based on unpaired Welch test.

