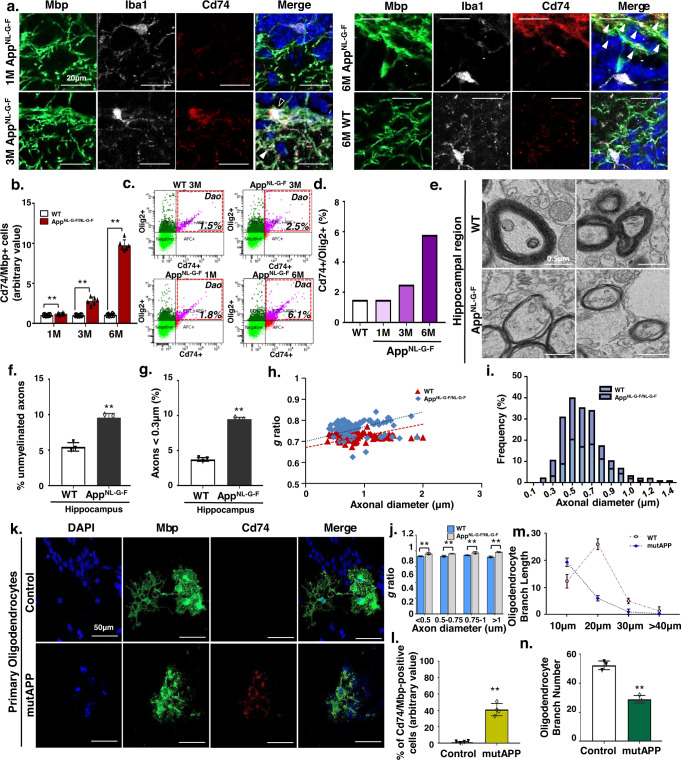
Fig. 2. Identification of a novel disease-related oligodendrocyte cluster in Aβ-reactive state.
a Immunohistochemistry for Mbp (green), Iba1 (white), Cd74 (red), and DAPI (blue) in the DG of WT at 6-months and AppNL-G-F mice at 1, 3, and 6-months of age. White, Cd74+oligodendrocyte; Black, Cd74+microglia. b Quantification of Cd74/Mbp-positive cells in WT and AppNL-G-F mice at 1, 3, and 6-months of age. All data are expressed as mean ± SEM, n = 6. **p < 0.01, two-sided Student’s t-test. c The frequencies of Cd74+ and Olig2+ were determined by FACS analysis. Representative FACS plots are shown. d Bar graph illustrating the results of the quantitative FACS analysis of Cd74-positive subsets of the Olig2-positive population. e Electron micrographs of axons in the DG from 6-month-old WT and AppNL-G-F mice. f Percentage of unmyelinated axons in the DG of 6-month-old WT and AppNL-G-F mice. All data are expressed as mean ± SEM, n = 3. **p < 0.01, two-sided Student’s t-test. g Percentage of small-caliber axons in DG regions from 6-month-old WT and AD mice. All data are expressed as mean ± SEM, n = 3. **p < 0.01, two-sided Student’s t-test. h Scatter plot of g-ratio values in DG regions from 6-month-old WT and AppNL-G-F mice. i Distribution of the axon caliber of DG regions from 6-month-old WT and AppNL-G-F mice. j g-ratio of 6-month-old WT and AD mice according to axon diameter. All data are expressed as mean ± SEM, n = 3. **p < 0.01, two-sided Student’s t-test. k Immunohistochemistry for Mbp (green), Cd74 (red), and DAPI (blue) in primary oligodendrocytes with mutAPP treatment. l Percentage of Cd74/Mbp-positive cells. Data are expressed as mean ± SEM, n = 4. **p < 0.01, two-sided Student’s t-test. m Branch lengths of mutAPP primary oligodendrocytes by branch length. Data are expressed as mean ± SEM, n = 3. *p < 0.05, two-sided Student’s t-test. n Number of oligodendrocyte branches. Data are expressed as mean ± SEM, n = 3. **p < 0.01, two-sided Student’s t-test. Source data and p-values in b, d, f–j, and l–n are provided as a Source Data file.

