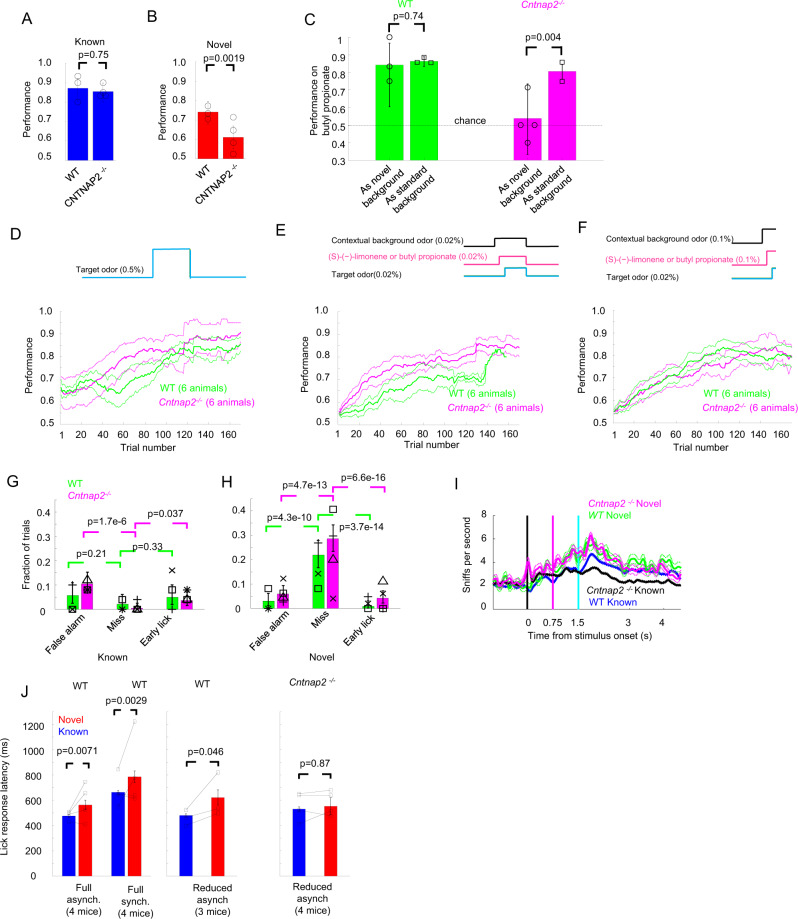
Fig. 10. Cntnap2−/− mice discrimination in novel backgrounds was selectively affected.
A Performance and 95% confidence interval for four Cntnap2−/− mice (n = 220 trials) and three WT mice (n = 140 trials) on known backgrounds for the reduced training set. Symbols indicate individual animal performance. Significance was calculated using a two-tailed Fisher exact test. B Performance in the novel background for the reduced test set. p-values were calculated with a two-tailed Fisher exact test. C Performance and 95% confidence intervals for butyl propionate when it was used as a novel and as a standard background for different mice cohorts. p-values were calculated using the Fisher exact test. D–F Odor learning curves were not affected in Cntnap2−/− mice compared to WT mice. Solid lines represent the mean response calculated using a 60-trial sliding window and dotted lines represent the mean±s.e.m calculated for 6 Cntnap2−/− and 6 WT mice. D Learning curves for the second pair of go target and no-go target at a high concentration (0.1%). E Learning curves for the first exposure of the standard background odors at 0.025% (1/5 of the final concentration) with the targets at their final concentration (0.025%). F Learning curves for the first exposure of the standard background odors at the final concentration of the background odors (0.1%). G Fraction of types of errors for WT and Cntnap2−/− mice for standard background odors for four Cntnap2−/− mice (n = 220 trials) and three WT mice (n = 140 trials). Error bars are the 95% confidence intervals. p-values were calculated using a two-tailed Fisher exact test. H Fraction of trials of types of errors with the 95% confidence interval for WT and Cntnap2-/- mice for novel background odors. I Sniff responses for Cntnap2−/− and WT mice for novel and standard background odors. Lines represent mean ± s.e.m. J WT mice lick response times were slower in the presence of novel background odors compared to the known background odors in both the asynchronous and the synchronous tasks. Error bars represent the s.e.m. p-values were calculated using a two-tailed Wilcoxon rank-sum test.

