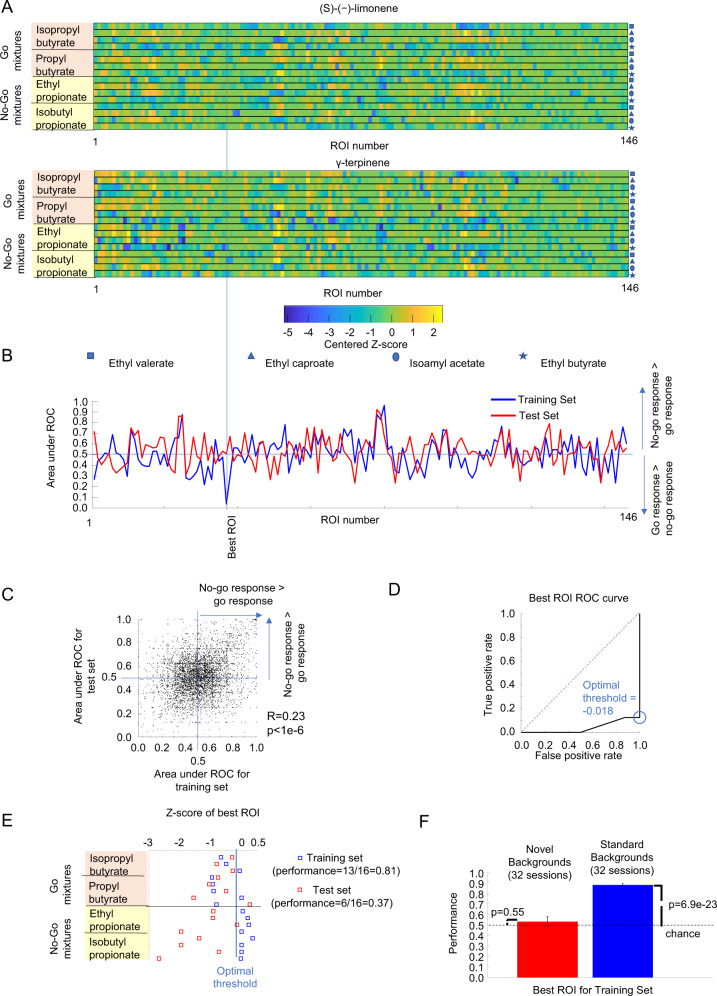
Fig. 2. Odor responses from individual glomeruli could not identify target odors in novel environments.
A Example of the average glomerular responses (as z-scores) of a WT mouse to the training set (16 mixtures) and responses to the test set with γ-terpinene as the novel background. The vertical line marks the ROI that best discriminated between the go mixtures from the no-go mixtures from the training set calculated using the auROC. B AuROC for the training set and the test set for all the ROIs of the example marking the position of the best ROI for the training set. C AuROC for the training set plotted against the auROC for the test set calculated from 32 recording sessions from 6 animals using real mixtures (5163 glomeruli). The value of r corresponds to the Pearson linear correlation. D ROC for the best glomerulus calculated from the training set for the above example. The circle indicates the optimal threshold to differentiate between the go mixtures and the no-go mixtures from the training set. E Example of the z-score responses of the best ROI, determined by the training set, to the 16 mixtures of the training set and the 16 mixtures of the test set. Each row represents the z-score of the best ROI for a given combination of target odor and contextual background odor from the training set (blue square) or the test set (red square). The blue vertical line represents the optimal threshold (z-score = −0.018) calculated from the training set. Z-score responses that exceed this threshold corresponded to no-go stimuli and responses below the threshold corresponded to go-stimuli. The performance for the test set was determined by the fraction of test set responses that were correctly discriminated by this threshold. F Performance of the best glomerulus for the training set and the test set for 6 WT mice, 32 recording sessions. Error bars represent the standard error of the mean. p-values were calculated using a t-test.

