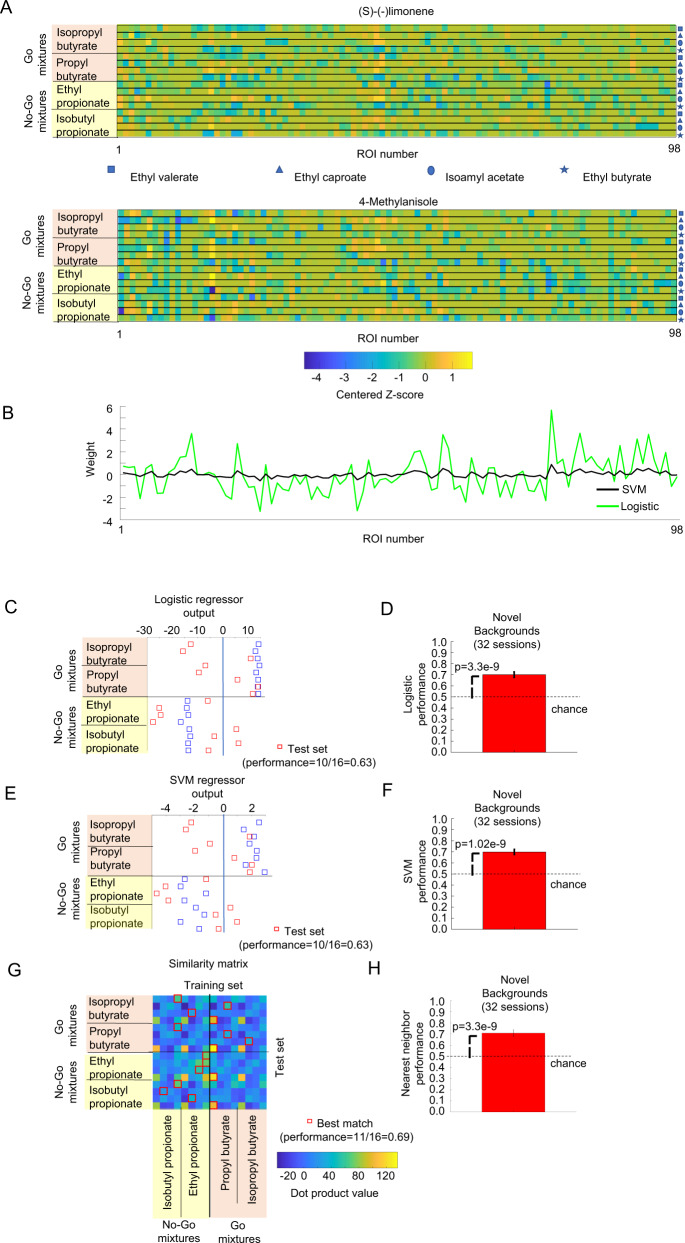
Fig. 3. Linear classifiers and NNC could identify odors in novel environments.
A Example of the average glomerular responses of a WT mouse to the 16 mixtures of the training set and responses to 16 mixtures of the test set with 4-methylanisole as the novel background. B Estimated weights of SVM with linear kernel and logistic linear classifiers trained using the training set for the example. C Output produced by multiplying the weights wi of the logistic linear classifier and adding the constant bias term w0 with the glomeruli activation. Each row represents the output produced by a given combination of target odor and contextual background odor from the training set (blue squares) or the test set (red squares). Correct performance consisted of positive responses for go stimuli and negative responses for no-go stimuli. D Performance of the logistic regressor calculated on data from 6 WT mice, 32 recording sessions on the test set, with the performance of each recording day using 100 instantiations of each of the responses of the test set using Eq. (1). Error bars are s.e.m. and p-values were calculated using a two-tailed t-test. E Same as C but using the SVM weights. F Performance of the SVM for the data from 6 WT mice, 32 recording sessions. Data are presented as mean values ± s.e.m. and p-values were calculated using a two-tailed t-test. G Example of a matrix of dot products between the 16 training set mixtures and the 16 test set mixtures used for calculating the NNC. Each target odor appeared mixed with each of the four contextual background odors. For each mixture in the test set, the red squares indicate the location of the most similar mixture from the training set. If the valence (go or no-go) of the target odor in the test mixture matched the valence of the most similar mixture (Nearest Neighbor), the trial was considered correct. H The performance of the NNC for novel background odors for 6 WT mice, 32 recording sessions. Data are presented as mean values ± s.e.m. and p-values were calculated using a two-tailed t-test.

