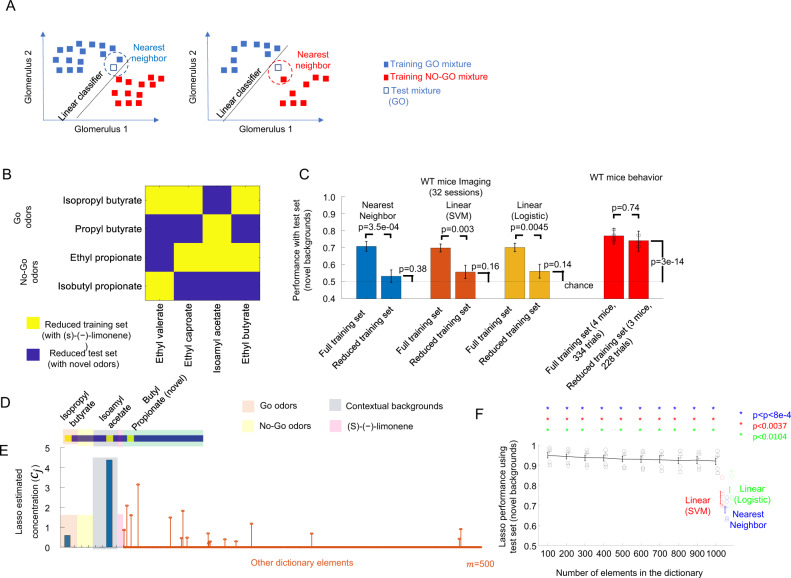
Fig. 7. Robust performance of WT mice with reduced training set.
A NNC and a linear classifier can misclassify a test set sample when the number of training mixtures is reduced. B Combinations of contextual background odors and target odors for the reduced training and test set. C Average performance (±s.e.m.) for linear classifiers and NNC (32 recording sessions 6 WT mice, 161.3 ± 39.8 glom per session). Comparison of algorithm performances using different training sets was done using a two-tailed t-test, with n = 32 recording sessions. Group performance and 95% confidence intervals for a mouse behavior. The group performance of a new cohort of three WT mice that were also trained with the reduced training set and tested with the reduced test set in the asynchronous task (n = 228 trials) was compared to the four WT mice that had trained with the full set and were evaluated with the full set (n = 334 trials). The p-value was calculated using the Fisher exact test. D–F Sparse representation algorithm, Lasso, identifies the odors present in a mixture. D Representation of 20 possible odors used to create odor mixtures. The yellow squares mark the odors selected for an example mixture consisting of a go target odor, a contextual background odor, and a novel background odor. E Concentrations assigned by the Lasso. The dictionary included 9 known elements and 491 randomly generated elements. Bars correspond to the estimated concentrations of the 9 known elements. Stems correspond to estimated concentrations for the randomly generated dictionary elements. The maximum of the estimated concentration was larger for the two targets go odors compared to the two target no-go odors. F Performance of the Lasso calculated for different sizes of dictionaries was compared to the performances of the NNC, SVM, and logistic regression. Individual symbols represent average performances for the 5 WT mice. Error bars represent the 10-90% percentiles of the 13200 simulations performed per dictionary size for the Lasso and the SVM, logistic regression, and NNC. Significance was calculated using a two-tailed t-test and comparing the average performance per animal between the NNC, SVM, and logistic regression against the Lasso performance for different dictionary sizes.

