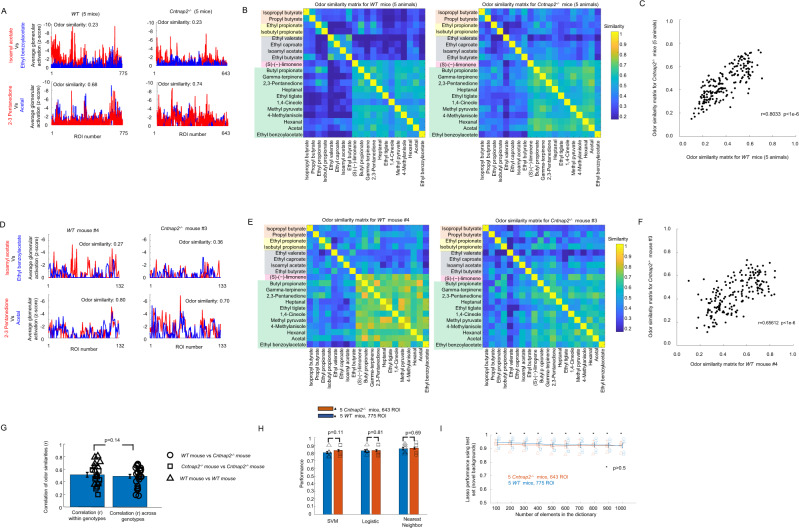
Fig. 9. Pairs of odors that evoked similar activity patterns in WT mice also evoked similar patterns in Cntnap2−/− mice.
A Patterns of glomerular activation using all available ROI per genotype for 4 example odors. Isoamyl acetate and ethyl benzoylacetate produced different patterns of glomerular activation in WT and Cntnap2−/− mice whereas 2–3 pentanedione and acetal produced similar glomerular activation patterns in both WT and Cntnap2−/− mice. B Odor similarity matrices for Cntnap2−/− mice and WT mice were calculated using all available ROI per genotype. C Similarity between 190 odor pairs calculated using all the WT mice glomerular responses versus similarity between odors calculated using all the Cntnap2−/− mice glomerular responses. D Patterns of glomerular activation using ROI from example individual animals of each genotype. E Odor similarity matrices for the example Cntnap2−/− mouse and WT mouse. F Similarity between 190 odor pairs calculated using the example WT mouse data against the similarity from the example Cntnap2−/− mouse. G Distribution of linear correlation coefficients of odor similarities (r) for pairs of animals of the same genotype (WT vs. WT, 10 animal pairs and Cntnap2−/− vs. Cntnap2−/− 10 animal pairs) and for pairs of animals of different genotypes (WT vs. Cntnap2−/−, 25 animal pairs). Error bars represent the mean ± s.e.m. Comparison between correlation coefficients was done using a two-tailed t-test. H Performance (mean ± s.e.m.) of SVM, logistic, and NNC classifiers calculated using Cntnap2-/- and WT mice glomerular activation data for target detection in novel environments trained with the full training set and tested with the full training set. Symbols represent average performance per animal. Performances were compared using a two-tailed t-test, with n = 50 mice-odor pairs per genotype. I Performance (mean ± s.e.m.) of the Lasso using Cntnap2−/− and WT mice glomerular data for the reduced test set using different sizes of dictionaries. Significance was calculated using a two-tailed t-test, with n = 5 mice per genotype.

