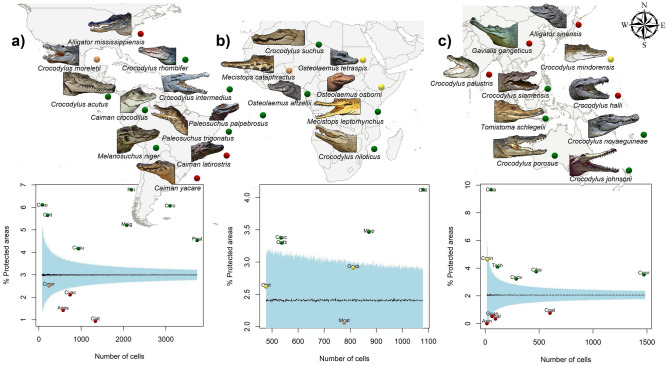
Figure 3.
Representation of distribution of crocodilian species and spatial relationship of the Mean Percentage Overlap (MPO) between each species range and the global PA networks. Results of null models: green dots denote values significantly higher than expected by chance, red dots denote values significantly lower than expected by chance, and yellow (above mean) and orange (below mean) dots denote non-significant (p < 0.05) values. (a) Crocodilian species in North, Central and South America (Amis = Alligator mississippiensis, Cyac = Caiman yacare, Clat = Ca. latirostris, Ccro = Ca. crocodilus, Cacu = Crocodylus acutus, Cint = Cr. intermedius, Cmor = Cr. moreletii, Crho = Cr. rhombifer, Mnig = Melanosuchus niger, Ppal = Paleosuchus palpebrosus, Ptri = P. trigonatus). (b) Crocodilian species in Africa and the Middle East (Cnil = Cr. niloticus, Csuc = Cr. suchus, Mcat = Mecistops cataphractus, Mlep = Me. leptorhynchus, Otet = Osteolaemus tetraspis, Oaft = O. aftezelli, Oosb = O. osborni). (c) Crocodilian species in Asia and Oceania (Asin = A. sinensis, Chal = Cr. halli, Cjoh = Cr. johnsoni, Cmin = Cr. mindorensis, Cnov = Cr. novaeguineae, Cpal = Cr. palustris, Cpor = Cr. porosus, Csia = Cr. siamensis, Ggan = Gavialis gangeticus, Tsch = Tomistoma schlegelii). Dashed lines indicate the mean percentage overlap from 1,000 randomizations, and the light blue surface represents the random range, with 95% confidence interval. The maps were created in ArcGIS Pro software60 and the illustrations of species were created by L-d-M, Lia.

