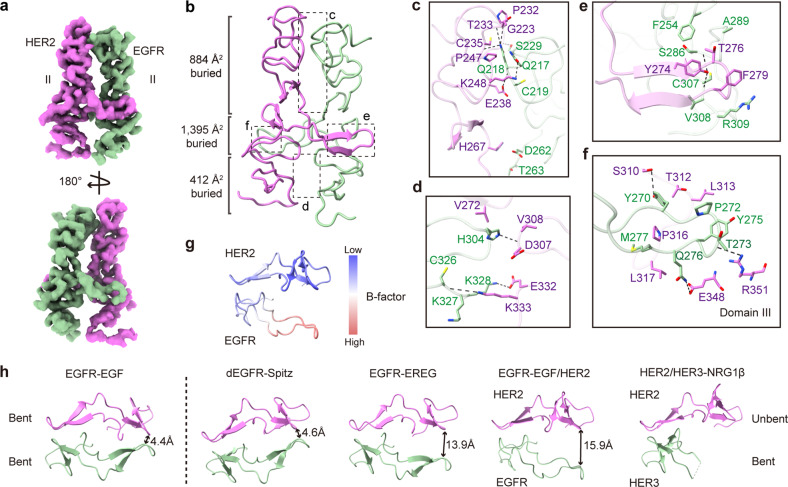
Fig. 3. Interaction details between EGFR and HER2.
a Cryo-EM map of the interface between Domain IIs of EGFR and HER2 shown in two views. b Structure of the EGFR/HER2 interface in ribbon presentation. EGFR is colored in green and HER2 is in magenta. The BSAs of different regions are indicated. c–f Interaction details between EGFR and HER2 as indicated in the insets of b. Residues involved in their interaction are shown with side chains. Black dashed lines represent hydrogen bond or salt bridge interactions (< 4.5 Å). g B-factor distribution of the DAs in the EGFR–EGF/HER2 structure. h Comparison of the structures of DAs in different HER dimers. From left to right: EGFR–EGF (PDB code: 1IVO), dEGFR–Spitz (PDB code: 3LTG), EGFR–EREG (PDB code: 5WB7), EGFR–EGF/HER2 (this study), and HER2/HER3–NRG-1β (PDB code: 7MN5). The DAs of the symmetric EGFR dimer exhibit the same conformation. For asymmetric dimers, the DAs of the unbent subunit pack closely with its counterpart, mimicking that of the symmetric EGFR dimer, whereas those of the bent subunit display various structures. The distances between DAs of the bent subunits and their partners are indicated.

