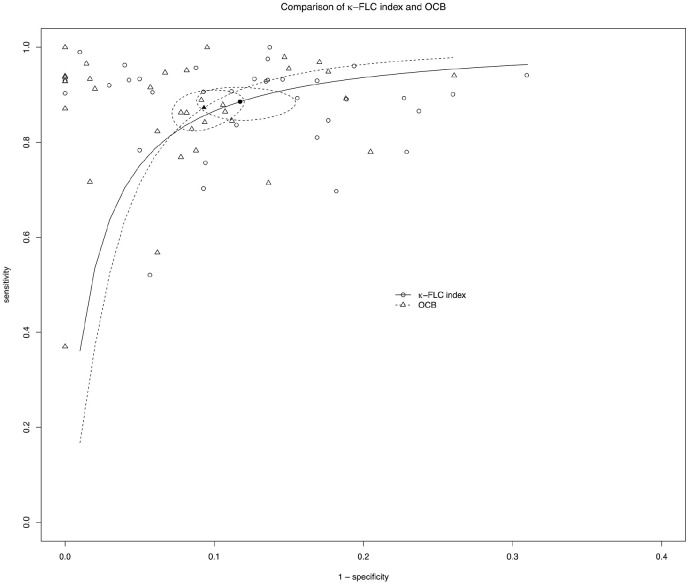
Figure 3.
Comparison of the diagnostic accuracy of κ-FLC index with OCB to identify CIS/MS patients
Bivariate summary estimates of sensitivity and specificity for κ-FLC index with OCB and the corresponding 95% confidence ellipse around these mean values are shown as well as the original data of the meta-analysis together with the corresponding sROC curves.
FLC: free light chain; OCB: oligoclonal band; sROC: summary receiver operating curve; CIS: clinically isolated syndrome; MS: multiple sclerosis.

