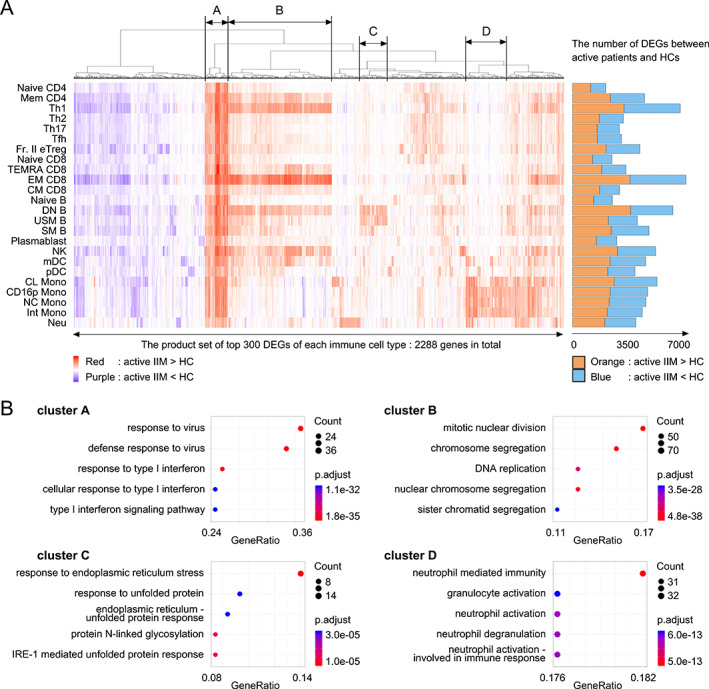
Figure 2.

(A) Differentially expressed gene (DEG) analysis of patients with active idiopathic inflammatory myopathy (IIM) versus healthy controls (HCs). The top 300 DEGs calculated in each immune cell type were selected and subjected to FDR‐based hierarchical clustering. Red: genes up‐regulated in patients with IIM versus HCs. Purple: genes down‐regulated in patients with IIM versus HCs. The numbers of DEGs in each immune cell type are presented as a bar graph on the right. Orange: genes up‐regulated in patients with IIM versus HCs. Blue: genes down‐regulated in patients with IIM versus HCs. (B) Pathway analysis of clusters A, B, C, and D identified in Figure 2A performed using ClusterProfiler. CL, classical; CM, central memory; CD16p, CD16 positive; DN B, double negative B; EM, effector memory; FDR, false discovery rate; Fr. II eTreg, fraction II effector regulatory T; Int, intermediate; MDA5, melanoma differentiation‐associated gene 5; mDC, myeloid DC; NC, non‐classical; NK, natural killer, Neu, neutrophil; pDC, plasmacytoid DC; SM B, switched memory B; TEMRA, terminally differentiated effector memory; Tfh, follicular helper T; Th1, T helpler 1; USM B, unswitched memory B.
