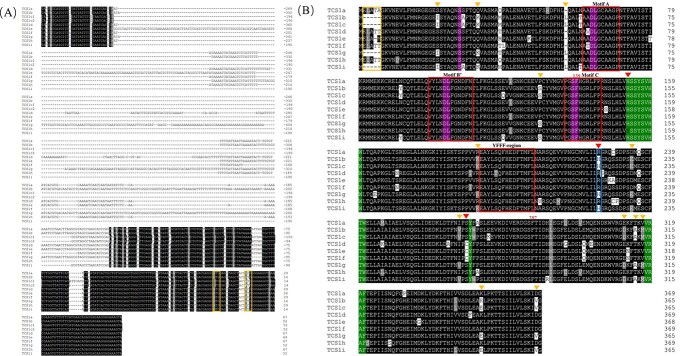
Figure 1.
Comparison of TCS1 allele promoter sequences and amino acid sequences. A Comparison of promoter sequences between TCS1 alleles. The yellow box marks the initiation codon (ATG). B Comparison of amino acid sequences of TCS1h and other TCS1s. The proposed SAM-binding motifs (A, B′, and C) and conserved region that are nominated as the ‘YFFF-region’ are shown in red empty boxes. The amino acid residues are marked in a blue empty box, and they played a critical role in substrate recognition. The nominated amino acids in substrate binding are indicated by purple (SAM) and red (methyl acceptor) boxes. The TCS1b, TCS1c, TCS1g, and TCS1i variant sites compared with TCS1a, TCS1d, TCS1e, TCS1f, and TCS1h are indicated by a brownish yellow triangle. The important mutation sites are marked with red triangles. The TCS1b, TCS1c, TCS1g, and TCS1i deletion motif ‘ELATA’ is marked with a yellow empty box.

