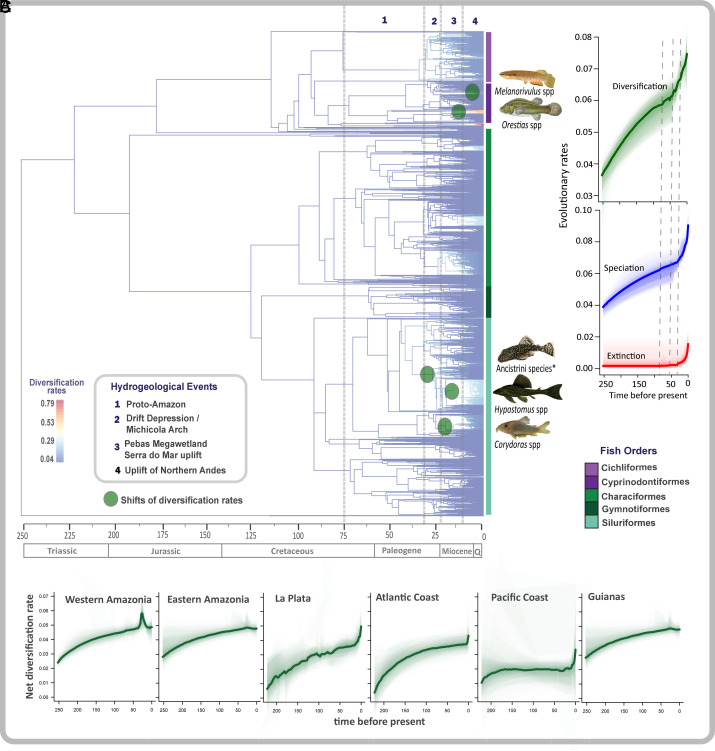
Fig. 2.
Changes in the rates of net lineage diversification among South American freshwater fishes. Tips represent 2,523 fish species. (A) Branch colors indicate net lineage diversification rate estimated by BAMM, where red indicates highest and blue lowest diversification rates. Significant shifts in diversification rates are shown as pale green circles on the branches. Selected representative clades of Melanorivulus, Orestias, Ancistrini, Hypostomus, and Corydoras species are illustrated. The principal orders are represented by colored columns to the right of the tree tips. The timescale at the bottom is expressed in millions of years ago (Ma). Vertical dashed lines indicate timing of the main principal hydrogeographic events detailed in the inset legend on the left. (B) Rates-through-time plots based on BAMM estimations, considering all bioregions together (see Material and Methods for parametrization details). The shaded areas around the curves correspond to 95% CIs of the estimated rates. Dashed lines indicate the time period when most of shifts in diversification rates were estimated. (C) Rates-through-time plots considering the species present in each bioregion separately. Rates of diversification, speciation, and extinction were estimated mainly within crown taxa. The five photographs: Wikipedia Commons. *Ancistrini species of genera Hopliancistrus, Guyanancistrus, Pseudolithoxus, Lasiancistrus, Pseudancistrus, Panaque, and Pterygoplichthys.

