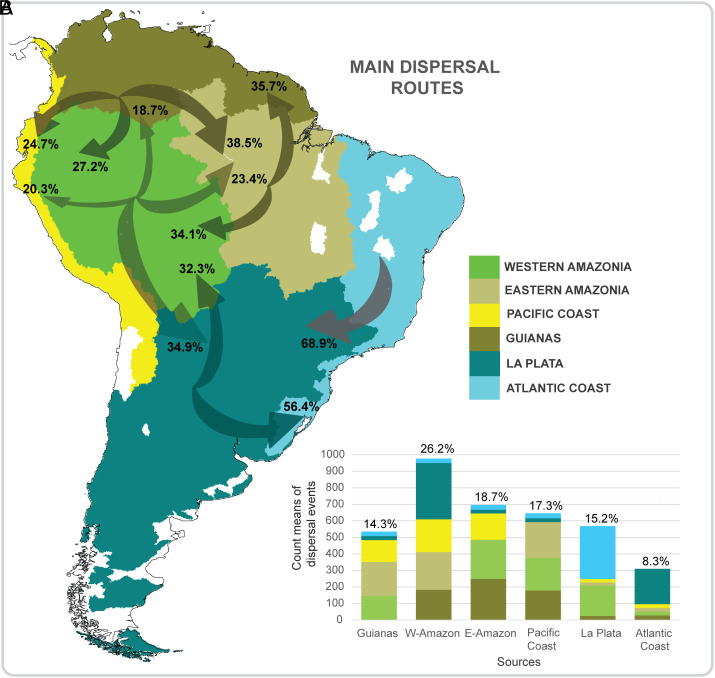
Fig. 3.
(A) Proportions of biogeographical dispersal events among bioregions. Arrows indicate dispersal directions, and numbers represent percentage of the mean (of total 20 simulations) for all dispersal events from source to sink bioregions. Width of arrows is proportional to the number of dispersal events. (B) Total count means of dispersal events from source (axis x) to destination bioregions (colored legend). Percentages over each column represent the relative contribution of each source bioregion to total number of dispersal events. The drainage basins in white were not considered in the study for lack of adequate sampling effort. For more details regarding dispersal analysis results, see SI Appendix, Tables S5–S7.

