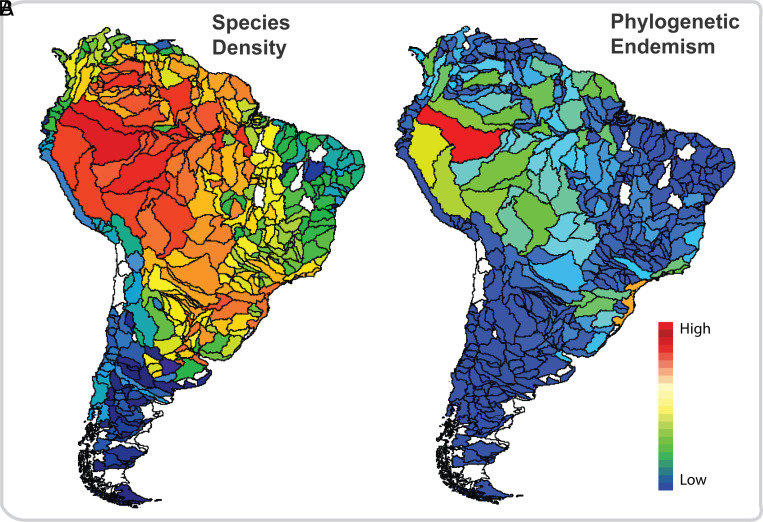
Fig. 5.
(A) Species-density map for 4,967 freshwater fish species. Density was calculated as Species/(Area)b, where the value of b was calculated using the Species–Area relationship (Species is the total number of species in a basin, and Area is the surface area of the basin). (B) PE (mean) for each drainage basin. PE for 2,523 species, a combination of the PD and weighted endemism measures, identifies bioregions to which unique phylogenetic lineages are restricted. The drainage basins in white were not considered in the study for lack of adequate sampling effort (see Methods for details).

