
Fig. 5.
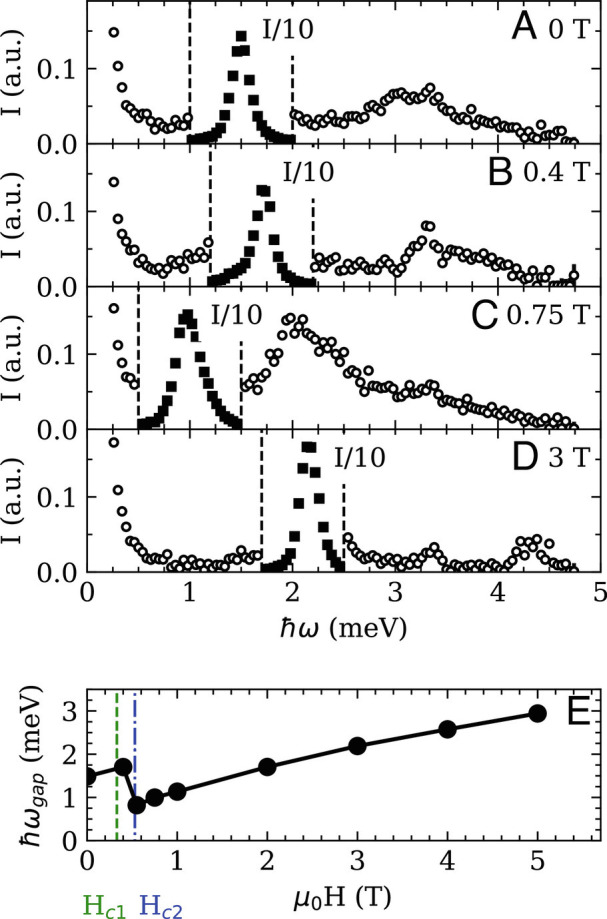
(A–D) Magnetic excitation spectrum for at the Γ point for four different magnetic field strengths applied along the direction. Intensity data near the main peak in each spectrum have been scaled down by a factor of 10 and are shown as filled symbols. (E) The lowest Γ−point mode energy as a function of magnetic field applied along the ( direction. In frames (A–D), the enhanced count rate at 3.X meV arises from a spurious accelerator-related process.