
Fig. 7.
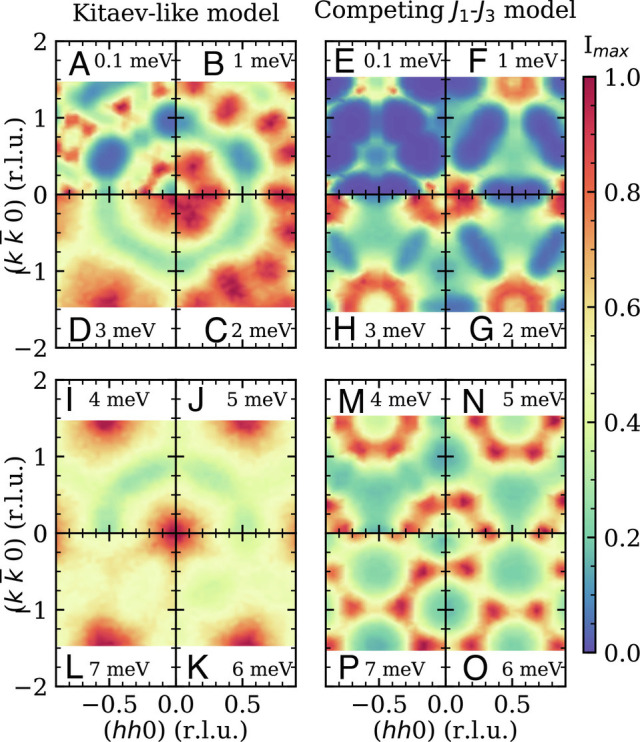
(A to P): Constant energy slices of the dynamical spin structure factor calculated by molecular dynamics at T = 2 K. These may be compared to the experimental results in Fig. 2. Color scales are arbitrary but consistent within each model. Subplots in the left column (A–D and I–L) with blue spines show constant energy slices for the model and subplots in the right column (E–G and M–P) for the XXZ model with the parameter set presented in Eqs. 14 and 13 , respectively.