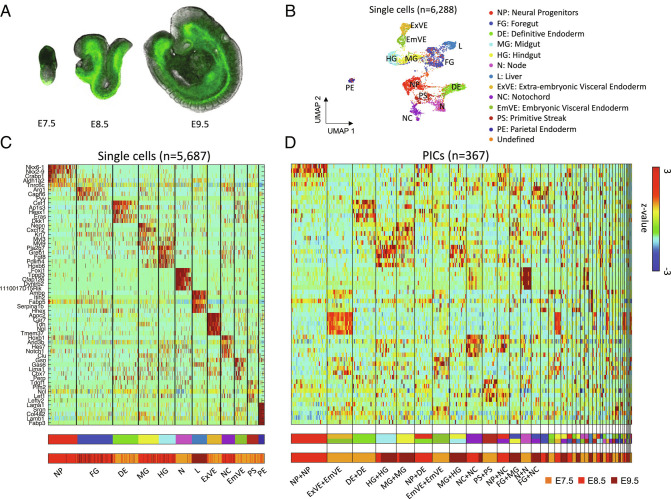
Fig. 1.
PIC-seq for developing mouse embryos. (A) A cartoon of mouse embryos (E7.5, E8.5, and E9.5) with fluorescently tagged FOXA2Venus based on the embryo images in ref. (26). (B) Clustering analysis identifies 12 cell types from scRNA-seq data from the developing mouse embryos. (C) A heatmap of the marker genes exhibits distinct expression profiles for the 12 identified cell types. The cell types from the clustering analysis and the embryonic days are shown at the Bottom. (D) Gene expression profiles of the identified marker genes for 367 PICs. The predicted cell types for the PICs are shown and their embryonic days are shown at the Bottom.

