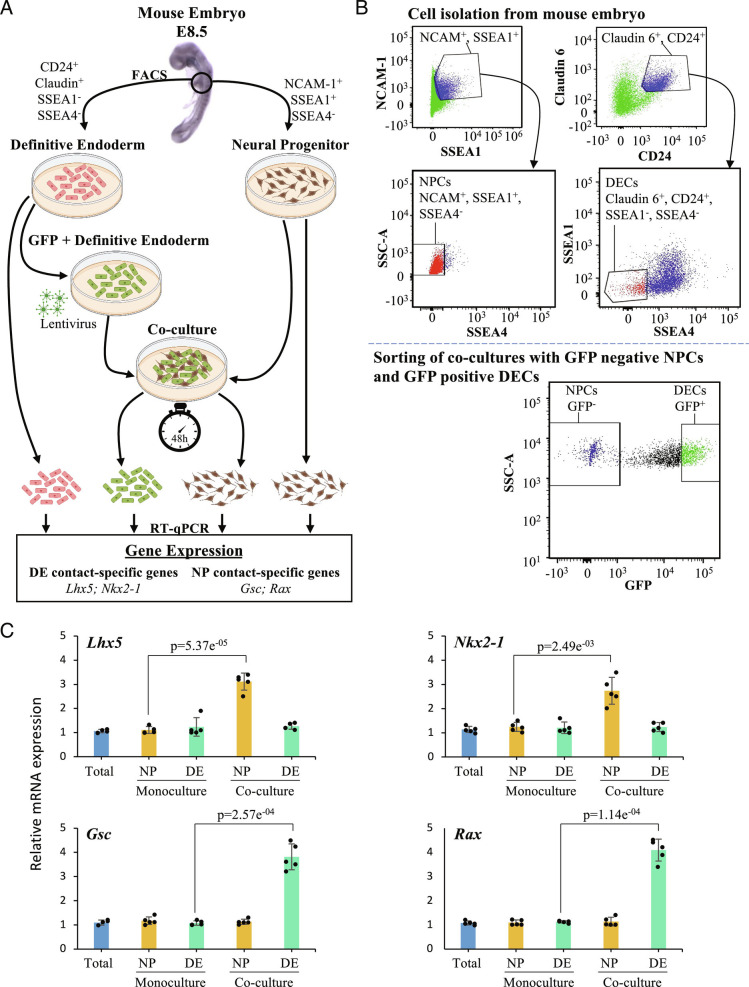
Fig. 4.
Experimental validation of the neighboring cell type prediction. (A) A model depicting the experimental approach used to analyze changes in the expression of contact-specific genes from NP and DE cells. Briefly, we isolated NP and DE cells from E8.5 mouse embryos, tagging DE cells with GFP. Then, we performed monoculture of DE and NP cells as well as co-culture of both cell populations for 48 h. After co-culture, DE and NP cells were sorted by GFP expression. Finally, we used mono-cultured and sorted DE and NP cells to perform RT-qPCR, which allowed us to measure the expression of the DE contact-specific genes Lhx5 and Nkx2-1 and the NP contact-specific genes Gsc and Rax. (B) FACS of NP and DE cells from mouse embryo at E8.5. On the left-top gate, we sorted double-positive cells for NCAM-1 and SSEA1 (blue population). From this population we sorted SSEA4-negative cells, which represent NP cells (red population, left-middle gate). On the right-top gate, we sorted double-positive cells for Claudin-6 and CD24 (blue population). Then, we sorted SSEA1- and SSEA4-negative cells, to obtain DE cells (red population, right-middle gate). The bottom gate shows the sorting of DE and NP cells after co-culture for 48 h. Cells were sorted accordingly to GFP expression since DE cells were tagged with GFP prior to their use in the co-culture experiment. (C) The analysis through RT-qPCR of contact-specific genes from NP and DE cells shows that after co-culture, NP cells upregulate Lhx5 (P = 5.37E−5) and Nkx2-1 (P = 2.49E−3) while DE cells increase the expression of Gsc (P = 2.57E−4) and Rax (P = 1.14E−4). Expression in these genes in the total embryonic tissue represents the control (lane 1, blue bar in every plot); the relative expression of these genes in the monoculture and coculture is calculated relative to the expression of these genes in the total embryonic tissue (N = 5). We performed a two-tailed Student’s t test.

