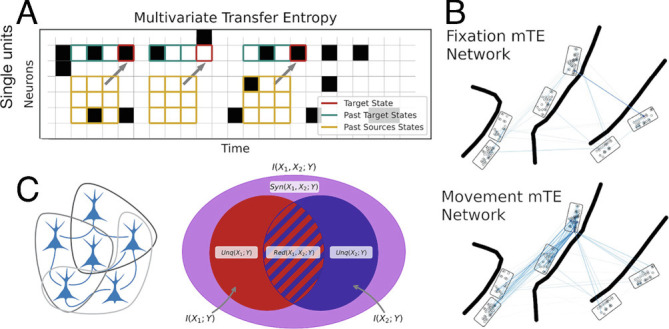
Fig. 2.

Information dynamics: inference of multivariate transfer entropy (mTE) transfer entropy networks and triadic synergy. (A) Schematic view explaining the intuition behind the multivariate transfer entropy. Spike events were first binned in nonoverlapping 5-ms windows, and three history bins of all neurons were used to predict each target neuron’s future. Red squares illustrate three examples of immediate future time points we intend to predict. Green squares illustrate three history spike bins of the target neuron, whereas the orange squares represent three history spike bins of all other neurons that may inform on the future of the target neuron. Note that the actual transfer entropy algorithm takes all time points into account, not only the three examples of immediate future time points illustrated in this schematic view. (B) Two example mTE transfer entropy networks for two different behavioral epochs, displayed as anatomical networks. The individual nodes reflect the anatomical positions of all simultaneously recorded neurons, the line shadings represent the relative amount of information transfer between neurons, the boxes reflect the implanted multielectrode arrays, and the thick black lines reflect the sulci of the cortex as shown with more detail in Fig. 3B. (C) Visualization of the triadic partial information decomposition. (Left) Schematic view of all possible sets of three neurons of the depicted neural network. Note that only all possible triads of the significant mTE networks were used to estimate triadic synergy (SI Appendix, Materials and Methods). (Right) Venn diagram illustrating how the total information of two source neurons informing a target neuron can be decomposed into a redundant part, two unique parts, and the synergistic part.
