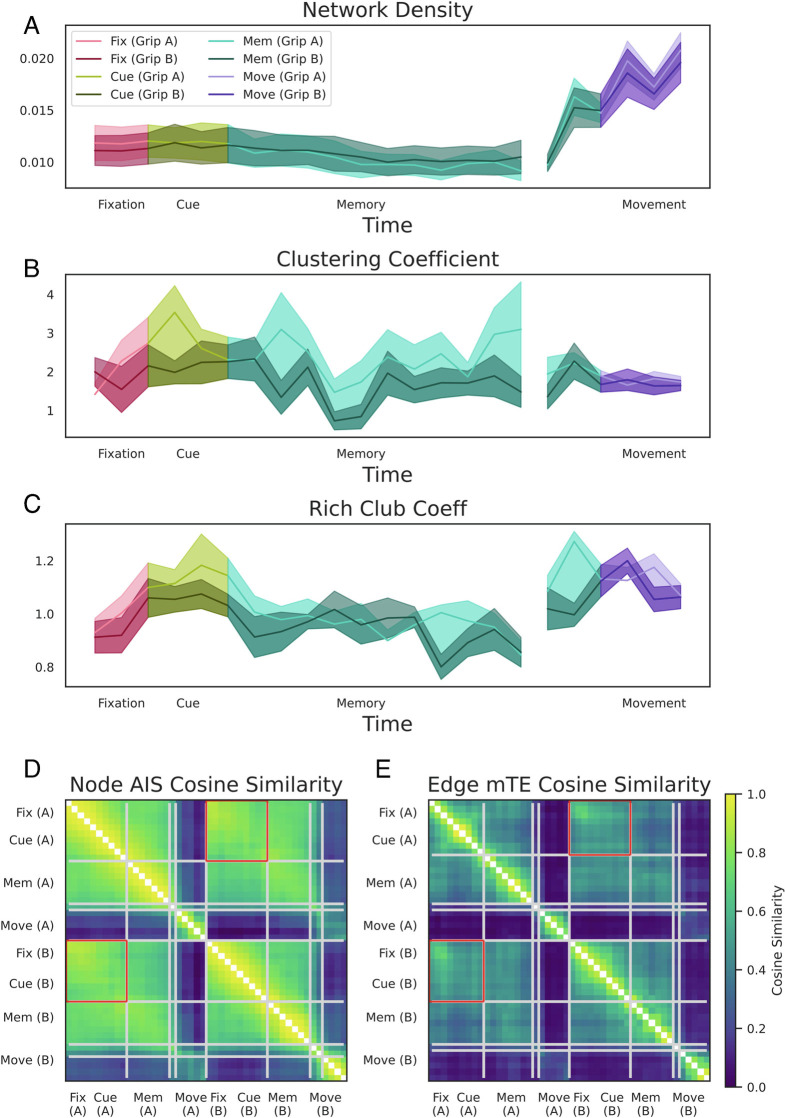
Fig. 6.
Differences in the effective network structure between behavioral states and grasping conditions. All displayed network measures are averaged across all recording sessions of all three monkeys. (A–C) Temporal dynamics (estimated based on the sliding windows) for the three measures of network topology separately for both grasping conditions (solid, precision condition; dashed, power condition): network density (A), normalized global clustering coefficient (B), and the normalized rich-club coefficient (C). Shaded error bars represent SE across recording sessions of all three monkeys. The network density increased dramatically in the movement epoch but remained constant during all “cognitive” states. In contrast, the networks showed a transient reconfiguration during the cue epoch: increasing the hierarchical rich-club structure and becoming more clustered. (D and E) Pairwise cosine similarity matrices of AIS neuron-level and mTE connection-level values over all time windows of both conditions. Gray lines indicate the boundaries of similar information network structure clusters as determined with a clustering algorithm. Note that the fixation and cue epoch clusters of both conditions belong to one cluster, indicated by the red box around the off-diagonal part of the cluster. Also note that the inferred clusters map onto boundaries between different behaviors.

