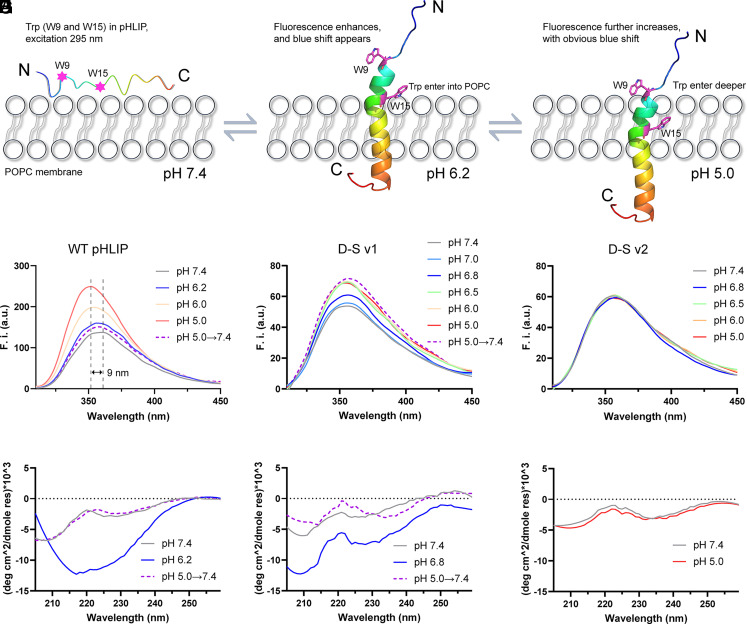
Fig. 2.
The Trp fluorescence and corresponding CD spectra of WT pHLIP, D-S v1, and D-S v2 during membrane insertion. (A–C) Schematic diagram of the insertion behaviors. W9 and W15 in WT pHLIP are shown in sticks. The C atoms are colored in purple, and all the hydrogen atoms are hidden. Trp fluorescence and corresponding CD results for (D and G) WT pHLIP, (E and H) D-S v1, and (F and I) D-S v2, respectively. WT pHLIP and D-S v1 start to fold and insert into POPC at pH 6.2 and 6.8, respectively. The fluorescence intensity and CD signals in the D-S v2 group did not change under different pH conditions.

