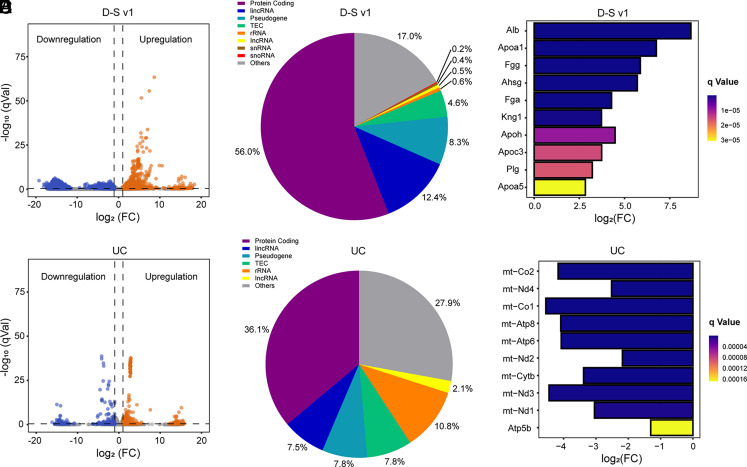
Fig. 5.
Transcriptomic profiling of the yielded cTME-EVs enriched by D-S v1 and UC. Volcano plots showing DEGs in (A) D-S v1 and (D) UC groups. q < 0.05 and a fold change (FC) >2 are used to define upregulation (red) and downregulation (blue), while the gray ones are not significant. Reads of the distribution of RNA biotypes from DEGs in (B) D-S v1 and (E) UC groups. The differential expression degrees of hub genes in (C) D-S v1 and (F) UC groups.

