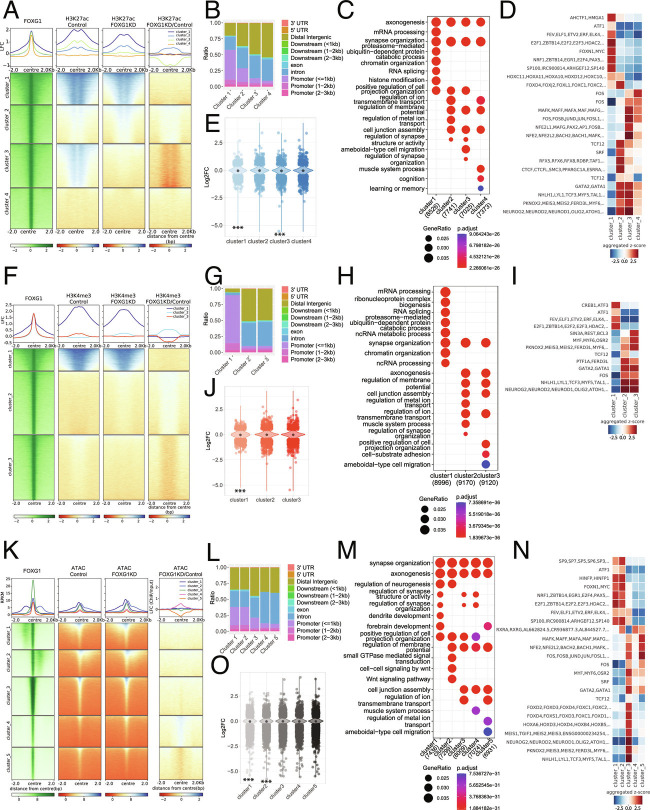
Fig. 3.
Reduced levels of FOXG1 alter the epigenetic landscape. (A) Heatmap of k-means clustered (k = 4) H3K27ac enrichment at 2 Kb up-/downstream of FOXG1 peak summits (Left, green) in control and FOXG1 KD conditions. Data are normalized by sequencing depth and input control as log2(ChIP/Input) for FOXG1, H3K27ac control and H3K27ac FOXG1 KD data. The difference between FOXG1 KD and control conditions was calculated from RPKM normalized bigwig files as log2 (FOXG1 KD/Control). The metaprofiles (Top) show the mean log2FC (LFC) of each cluster. (B) Genomic distribution of H3K27ac enrichment at FOXG1 peaks, according to k-means clusters from A, displayed as a stacked bar graph. (C) Top 10 differentially enriched GO-terms for the respective k-means clusters as shown in A. Bottom: Scales of gene ratios and adjusted P-value, X-axis: total number of genes per cluster. (D) TF-binding differential motif analysis according to the clusters of H3K27ac enrichment at FOXG1-binding regions as shown in A. Scale in Z-score. (E) Violin plot depicting the distribution of DEGs upon FOXG1 KD at k-means clusters of H3K27ac enrichment at FOXG1 peak as shown in A. Y-axis: log2FC of gene expression; X-axis: clusters. The black dot marks the median of log2FC of DEGs in each cluster. (F) Heatmap of k-means clustered (k = 3) H3K4me3 enrichment 2 Kb up-/downstream of FOXG1 peak summits (Left, green) in control and FOXG1 KD conditions. Data representation as in A. (G) Genomic distribution of clustered H3K4me3 enrichment at FOXG1 peaks. (H) GO-term analysis of clustered H3K4me3 enrichment at FOXG1 peaks. Representation as in C. (I) TF-binding differential motif analysis of the three k-means clusters of H3K4me3 enrichment at FOXG1-binding regions. (J) Violin plot depicting the distribution of DEGs upon FOXG1 KD at the three k-means clusters (according to F) of H3K4me3 enrichment at FOXG1 peaks. Representation as in E. (K) Heatmap of k-means clustered (k = 5) ATAC enrichment 2 Kb up-/downstream of FOXG1 peak summits (Left, green) in control and FOXG1 KD conditions. Data representation as in A. (L) Genomic distribution of ATAC enrichment according to the five k-means clusters shown in K at FOXG1 peaks. (M) GO-term analysis of clustered ATAC enrichment at FOXG1 peaks. Representation as in C. (N) TF-binding differential motif analysis of the five clusters of ATAC enrichment at FOXG1 binding regions. (O) Violin plot depicting DEGs upon FOXG1 KD at five k-means clusters of ATAC enrichment at FOXG1 peaks. Representation and statistics as in E. (E, J, O) GeneOverlap Fisher’s exact test *P < 0.05, **P < 0.01, ***P < 0.001. Threshold for GO-term enrichment analyses: P< 0.01. (n = 2 for all data sets).

