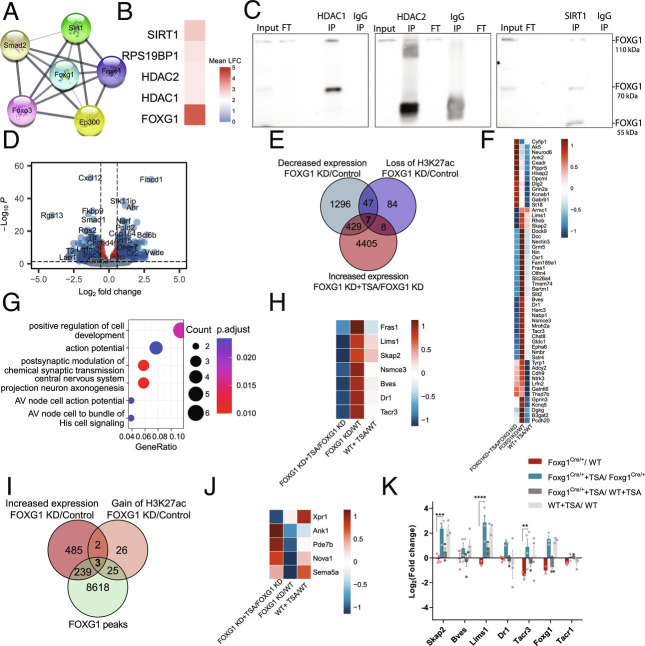
Fig. 4.
FOXG1 influences HDAC function both in vitro and in vivo. (A) STRING DB predictions of FOXG1-interacting HATs and HDACs. Line thickness indicates the strength of data support. (B) Heatmap of enriched HDACs upon FOXG1 pull-down after its overexpression in N2A cells according to (27). (C) Immunoblots after co-IP, demonstrating interaction between HDAC1, HDAC2, SIRT1 and FOXG1 in hippocampal tissue from adult WT animals (n = 1). (D) Volcano plot showing 992 DEGs of DIV11 hippocampal neurons upon TSA treatment alongside FOXG1 KD (n = 4). DEGs from FOXG1 KD+TSA/FOXG1 KD+DMSO analysis were intersected with DEGs from FOXG1 KD/Control analysis. DEGs upon TSA treatment under control conditions were removed to exclude FOXG1-independent effects of HDAC inhibition. Y-axis: adjusted P-value; x-axis: log2FC. Color code and thresholds as represented as in Fig. 1A. (E) DEGs assuming FOXG1-HDAC interaction according to repression model. Venn diagram shows the intersection of DEGs with decreased expression (green) and decreased H3K27ac (blue) upon reduced levels of FOXG1, and DEGs with increased expression upon TSA treatment (red) after FOXG1 KD. (F) Heatmap of 54 genes at the intersection of reduced H3K27ac and gene expression upon FOXG1 KD resulting from E. Scale shows log2FC upon respective conditions shown in the X-axis. (G) GO-term enrichment analysis shows the top biological processes affected in the 54 genes according to repression model. (H) Heatmap of 7 genes at the intersection of reduced H3K27ac and gene expression upon FOXG1 KD, and rescued upon TSA treatment. Scale as in F. (I) DEGs assuming FOXG1-HDAC interaction according to recruitment model. Venn diagram demonstrates the intersection of FOXG1 peaks (green), DEGs with increased expression (red) and gain of H3K27ac (orange) upon reduced levels of FOXG1. (J) Heatmap of 5 genes at the intersection of gain of H3K27ac and increased gene expression upon Foxg1 KD assuming the recruitment model resulting from I. Scale as in F. (K) qRTPCR validation of the repression model in vivo. Systemic TSA treatment of 6 wk old Foxg1cre/+ mice rescued (blue) the reduced expression of the targets Tacr3, Lims1, and Skap2 upon FOXG1 haploinsufficiency (red). Tacr1 is a nontarget control, showing no rescue effect upon TSA treatment. Mean ± SEM, Two-way ANOVA with Tukey’s multiple comparisons: *P < 0.05, **P < 0.01, ***P < 0.001. (n = 3 to 5).

