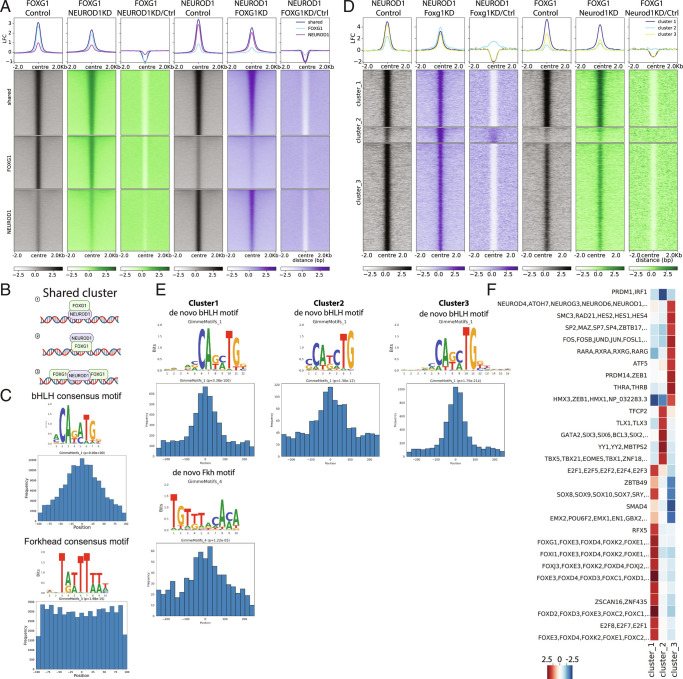
Fig. 6.
FOXG1 and NEUROD1 act in concert rather than up- or downstream from each other. (A) Heatmap of FOXG1 (green) and NEUROD1 (purple) enrichment clustered into unique and shared regions under control (gray), NEUROD1 KD, and FOXG1 KD conditions. Data are normalized by sequencing depth and input control as log2(ChIP/Input). The difference between FOXG1 KD-Control and NEUROD1 KD-Control conditions were calculated from RPKM normalized bigwig files as log2(TF KD/Control). The metaprofiles (Top) show the average log2FC (LFC) of each cluster. (B) Scheme of binding modes that classify for categorization as shared binding sites. 1: NEUROD1 binds to its bHLH/E-box motif at the chromatin and indirectly brings in FOXG1. 2: FOXG1 binds to its Fkh motif at the chromatin and indirectly brings in NEUROD1. 3: Binding sites of NEUROD1 and FOXG1 co-occur near a respective peak center (example depicts NEUROD1 as peak center). (C) Positional preference plots and motif logos of bHLH (Top) and Fkh (Bottom) motifs at FOXG1/NEUROD1 shared regions retrieved from de novo motif analysis. (D) Heatmap of k-means clustered (k = 3) NEUROD1 (purple) and FOXG1 (green) enrichment 2 Kb up-/downstream of differential NEUROD1 binding sites retrieved from DiffBind analysis between FOXG1 KD and control conditions. Data representation as in A. (E) Positional preference plots and motif logos of bHLH (Top) and Fkh (Bottom) motifs at sites with significant alteration of NEUROD1 binding upon FOXG1 KD, according to the three clusters from D, retrieved from de novo motif analysis. (F) Heatmap showing differential TF-binding motif analysis clustered at differential NEUROD1 binding sites as shown in D. (FOXG1 ChIP-seq: NEUROD1 KD n = 2, Control n = 1; NEUROD1 ChIP-seq: FOXG1 KD n = 2, Control n = 2).

