Fig. 7.
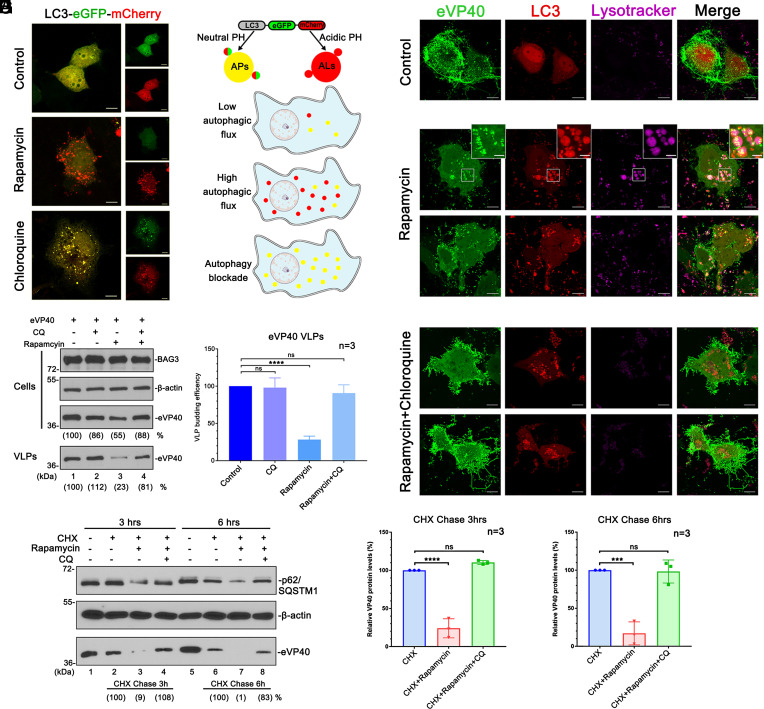
mTORC1/CASA targets VP40 into autolysosomes. (A and B) LC3-eGFP-mCherry is a dual-fluorescing autophagy monitoring reporter that will be predominantly yellow (autophagosomes; APs) under conditions of neutral pH due to low autophagic flux (control) or an autophagy blockade (CQ treatment), whereas LC3-eGFP-mCherry will be predominantly red (autolysosomes; ALs) under conditions of acidic pH due to high autophagic flux (rapamycin treatment). (C and D) eVP40 VLP budding assay and VLP quantification (bar graph) in Huh7 cells treated as indicated. Statistical significance was analyzed by one-way ANOVA. ns: not significant, ****P < 0.0001. (E–G) Confocal images of Huh7 cells co-expressing GFP-eVP40 (green) and LC3-mCherry (red) and either mock-treated (control), treated with rapamycin (200 nM) alone, or treated with rapamycin (200 nM) plus CQ (10 µM). Cells were labeled with lysotracker-deep red (magenta). The Inset panels highlight the colocalization of eVP40 aggregates with LC3-marked lysotracker-labeled puncta under treatment with autophagy inducer, rapamycin. (Scale bar, 10 µm in main panels and 2 µm in Inset panels.) (H and I) Representative CHX (10 µg/mL) chase assay and cellular eVP40 quantification. Statistical significance was analyzed by one-way ANOVA. ns: not significant, ***P < 0.001, ****P < 0.0001.

