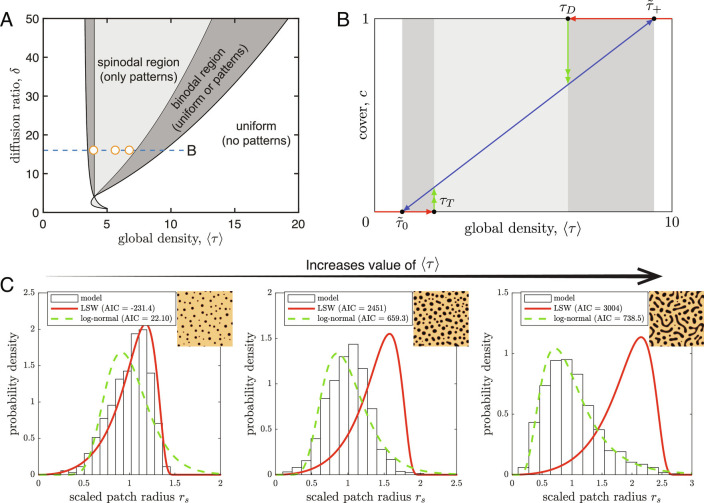
Fig. 5.
Physics-based indicators for ecosystem degradation: patch-size distributions, cover, and local densities. (A) Spinodal and binodal curves separate regions in the two-parameter space, 1) where patterns form through growth of small inhomogeneities (spinodal decomposition; spinodal region), 2) where patterns can only form out of large inhomogeneities (“nucleation sites”; binodal region), and 3) where patterns cannot form. Movie S3 shows the spatial dynamics behavior of the phase-separation patterns within the spinodal regions. (B) Patchy ecosystems respond to changes in global densities by adapting their cover, following the linear relationship of Eq. 6 (blue line), without changing local densities. Shifts from patchy to uniform states occur at and , and shifts from uniform to patchy states occur through diffusive instabilities of the uniform states at and , see SI Appendix, Texts S4 and S6 for a derivation of these tipping points. (C) As environmental conditions become harsher, here expressed as the global density of the conserved species (the spatial average of ), patch-size distributions change from Right skewed (log-normal) to Left skewed and approach a theoretical probability density function derived by Lifshitz–Slyozov–Wagner (LSW). Here parameter is 3.5, 5.0, and 7.5 for cases from Left to Right, respectively.

