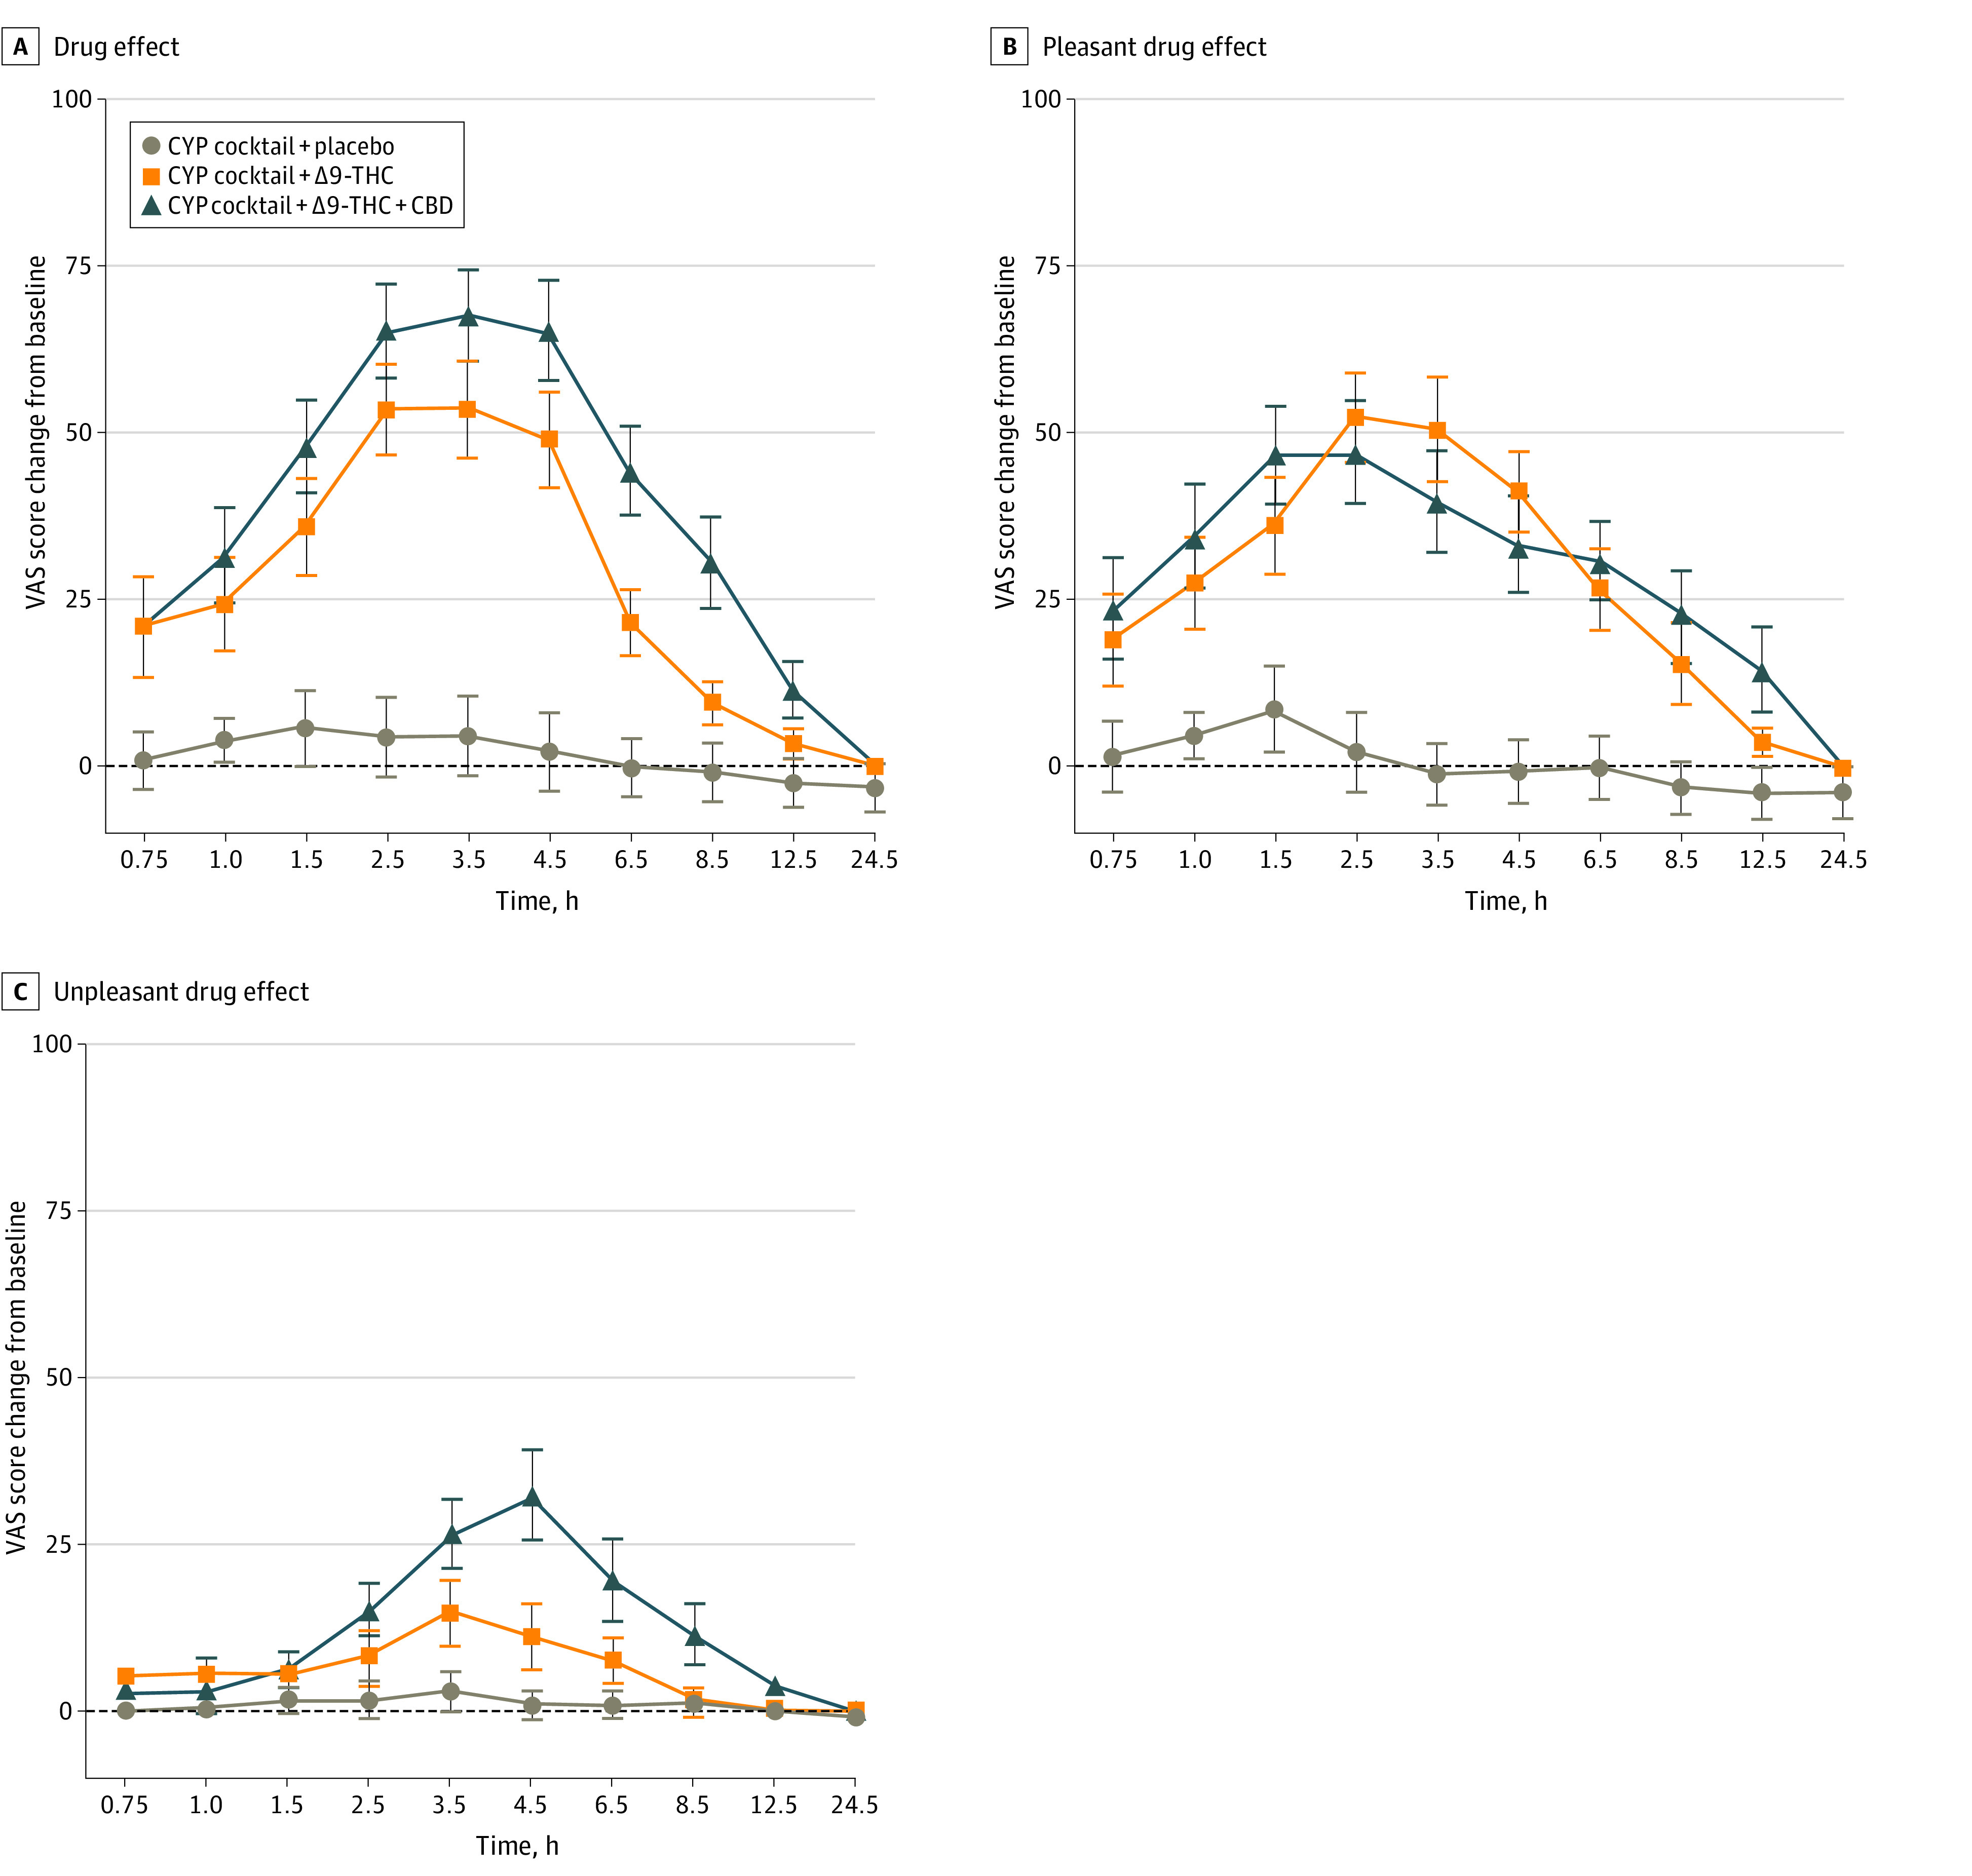
Figure 3. Change From Baseline Mean Ratings for the Visual Analog Scale Items (A) Drug Effect, (B) Pleasant Drug Effect, and (C) Unpleasant Drug Effect From the Drug Effect Questionnaire Displayed Over Time.

Scores ranged from 0 (not at all) to 100 (extremely). Error bars indicate standard error of the means. Horizontal axes are not accurate time scales and represent the time points at which subjective drug effects were assessed following cannabis administration. The sample size was 18 for all outcomes. CBD indicates cannabidiol; CYP, cytochrome P450; THC, tetrahydrocannabinol; VAS, visual analog score.
