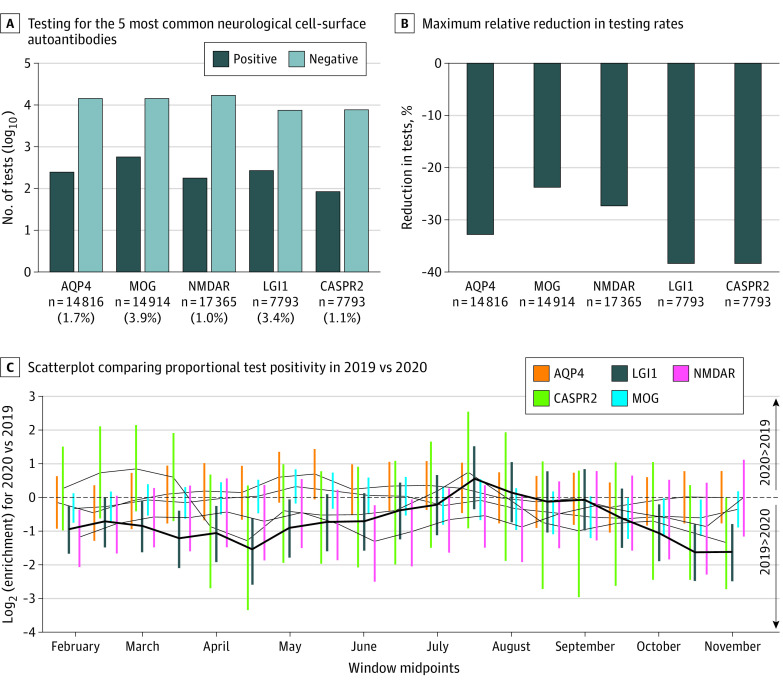
Figure. Autoantibody Positivity Rates Across 2019 vs 2020.
A, Autoantibody testing requests and positive results for the 5 most common neurologic cell-surface autoantibodies. B, The maximum relative reduction in testing rates between sliding 90-day windows in 2019 and 2020 for each autoantibody. C, Scatterplot comparing proportional test positivity in 2019 compared to 2020, using sliding 90-day windows. Negative log2 enrichment values indicate lower proportional positivity in 2020 relative to 2019. The size of points is proportional to the −log10 P value of each comparison. Lines connect adjacent points for each autoantibody. AQP4 indicates aquaporin-4; CASPR2, contactin-associated proteinlike 2; LGI1, leucine-rich glioma-inactivated 1; MOG, myelin-oligodendrocyte glycoprotein; NMDAR, N-methyl-D-aspartate receptor.

