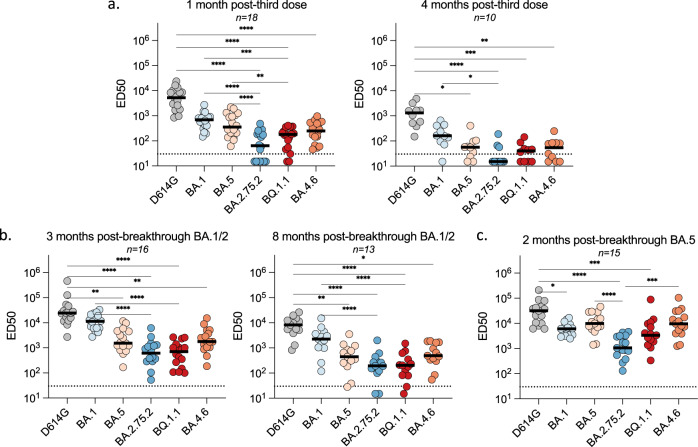
Fig. 4. Sensitivity of SARS-CoV-2 D614G and Omicron subvariants to sera from vaccinated, or infected-then-vaccinated individuals.
Neutralization titers of the sera against the indicated viral variants are expressed as ED50. a. Neutralizing activity of sera from individuals vaccinated with 3 doses of Pfizer vaccine. Sera were sampled at 1 month (left panel; n = 18) and 4 months (right panel; n = 10) after the third dose. b Neutralizing activity of sera from Pfizer-vaccinated recipients after BA.1/BA.2 breakthrough infection. Sera were sampled about 3 months (left panel; n = 16) and 8 months (right panel; n = 13) after the breakthrough. c Neutralizing activity of sera from Pfizer-vaccinated recipients after BA.5 breakthrough infection. Sera were sampled about 2 months after the breakthrough (n = 15). The dotted line indicates the limit of detection (ED50 = 30). Black lines represent the median values. Two-sided Friedman test with Dunn’s test for multiple comparisons was performed between each viral strain at the different time points; *p < 0.05; **p < 0.001; ***p < 0.0001; ****p < 0.0001. 1 month post-third dose: D614G versus BA.2.75.2, P < 0.0001; D614G versus BQ.1.1, P < 0.0001; D614G versus BA.4.6, P < 0.0001; BA.1 versus BA.2.75.2, P < 0.0001; BA.1 versus BQ.1.1, P = 0.0005; BA.5 versus BA.2.75.2, P < 0.0001; BA.5 versus BQ.1.1, P = 0.0033. 4 months post-third dose: D614G versus BA.5, P = 0.0152; D614G versus BA.2.75.2, P < 0.0001; D614G versus BQ.1.1, P = 0.0003; D614G versus BA.4.6, P = 0.0025; BA.1 versus BA.2.75.2, P = 0.0123. 3 months post-breakthrough BA.1/2: D614G versus BA.5, P = 0.0034; D614G versus BA.2.75.2, P < 0.0001; D614G versus BQ.1.1, P < 0.0001; D614G versus BA.4.6, P = 0.0071; BA.1 versus BA.2.75.2, P < 0.0001; BA.1 versus BQ.1.1, P < 0.0001. 8 months post-breakthrough BA.1/2: D614G versus BA.5, P = 0.0024; D614G versus BA.2.75.2, P < 0.0001; D614G versus BQ.1.1, P < 0.0001; D614G versus BA.4.6, P = 0.0173; BA.1 versus BA.2.75.2, P < 0.0001; BA.1 versus BQ.1.1, P < 0.0001. 2 months post-breakthrough BA.5: D614G versus BA.1, P = 0.0192; D614G versus BA.2.75.2, P < 0.0001; D614G versus BQ.1.1, P = 0.0009; BA.5 versus BA.2.75.2, P < 0.0001; BA.2.75.2 versus B.4.6, P = 0.0002. Source data are provided as a Source Data file.

