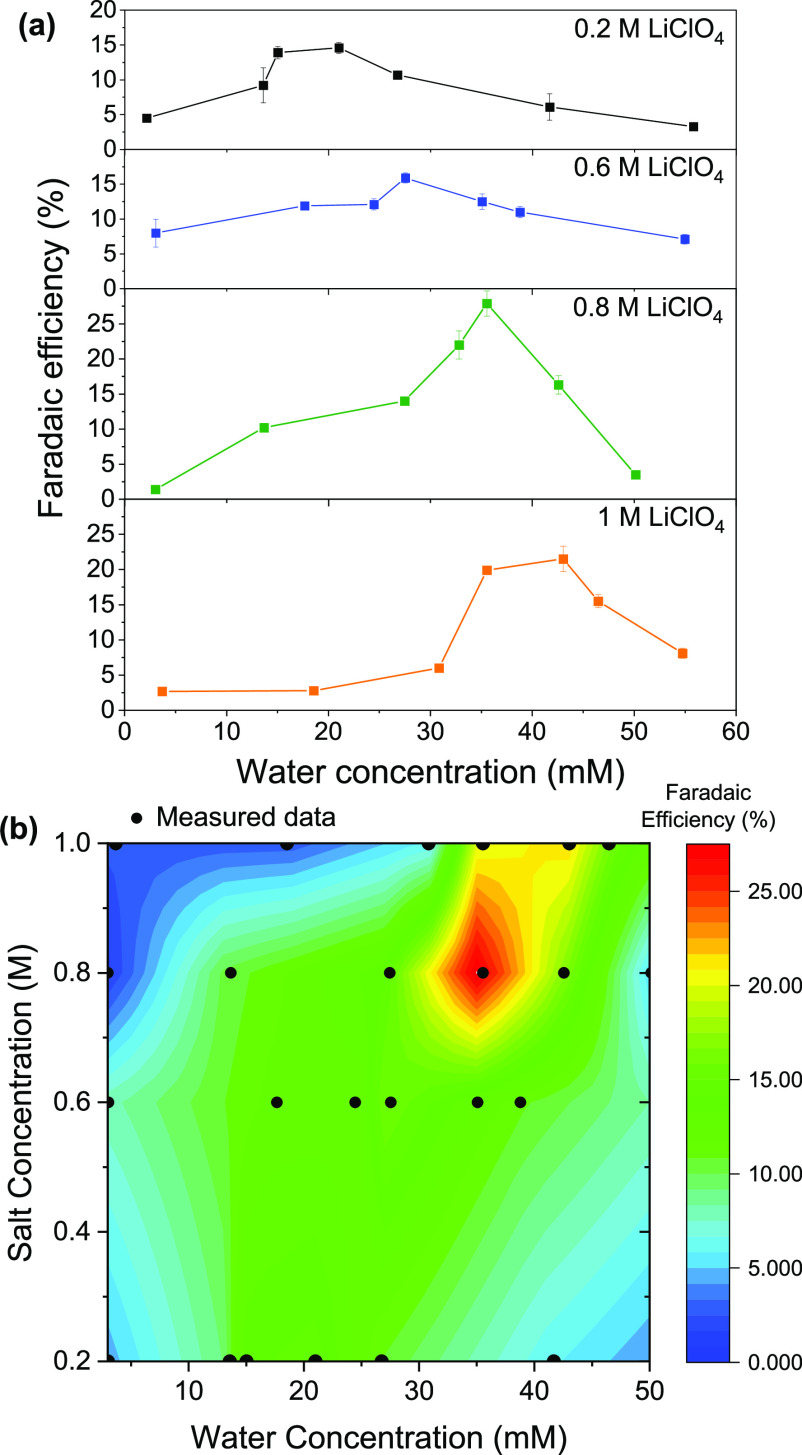
Figure 1.
(a) Effect of initial water concentration on Faradaic efficiency in electrolytes of 0.2 M, 0.6 M, 0.8 M, 1 M LiClO4 in THF with 1% v/v ethanol. In each experiment, 10 C was passed at a current density of −2 mA cm–2. Each data point represents a single experimental measurement. Faradaic efficiency data can be found in Table S1. Error bars represent the standard error calculated from the standard addition method of ammonia quantification (see Supporting Information, Figure S1). (b) A heat map showing the variation in Faradaic efficiency with LiClO4 concentration and water concentration, using data from panel a. Intermediate values have been obtained by linear interpolation between measured values. Measured values are shown as black circles.

