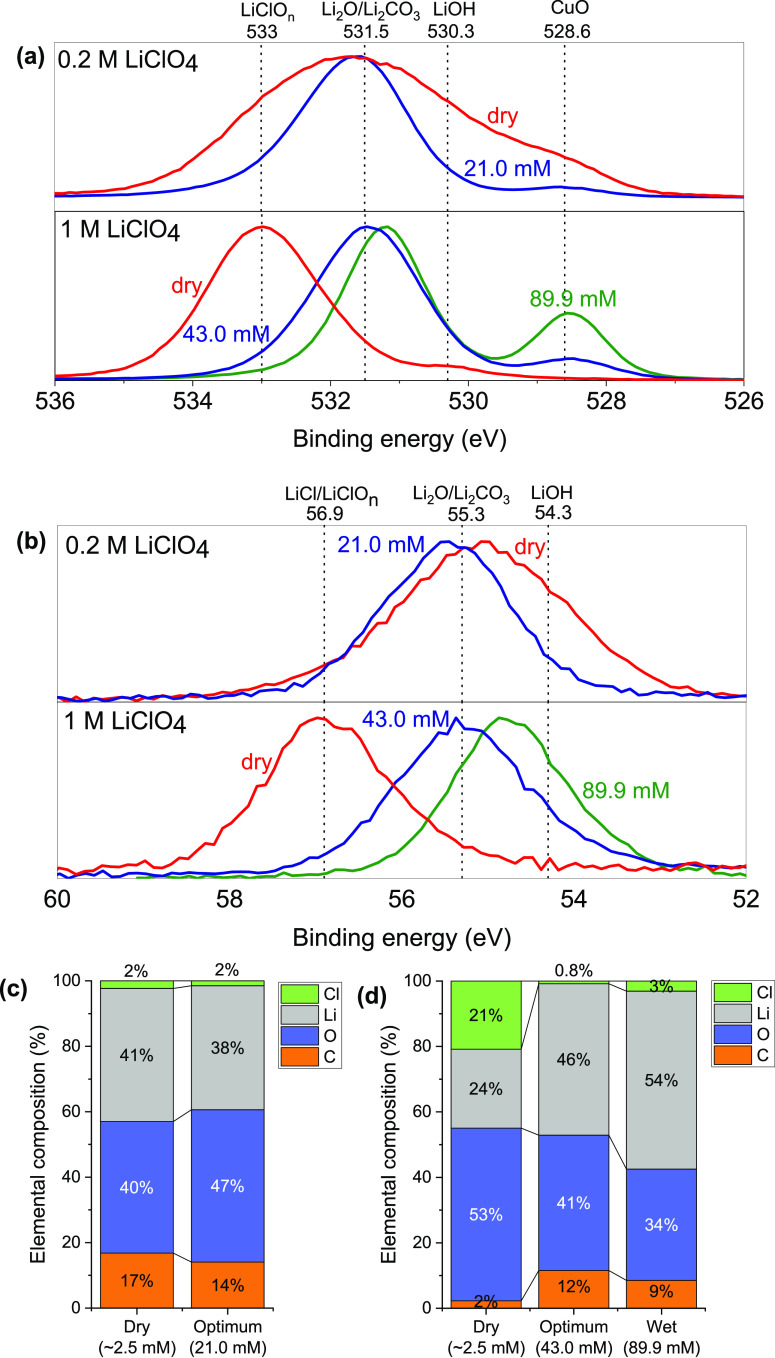
Figure 3.
X-ray Photoelectron Spectroscopy measurements: (a) O 1s core level spectra, (b) Li 1s core level spectra, measured for electrode SEIs following experiments in 0.2 and 1 M LiClO4 electrolytes, under dry (red line), optimum initial water concentration (blue line) and wetter than optimum (green line) conditions. (c-d) Relative elemental compositions of C, O, Li, and Cl under dry and wet conditions for 0.2 and 1 M LiClO4 electrolytes, respectively. Other elements observed in trace amounts have been excluded. H cannot be detected by XPS so is also excluded but will be present in the SEI.28 Data for dry samples is replotted from previous work.28 All samples were gently rinsed in 0.1 mL of THF after the experiment to remove dried electrolyte from the surface. Spectra are all normalized to their respective peak maxima. Quantitative peak fitting is not presented here due to small differences in binding energy peak positions for Li2O and Li2CO3 and LiClOn species. Attempts at peak fitting to determine specific Li and O species can be found in the Supporting Information (Figures S5, S6).

