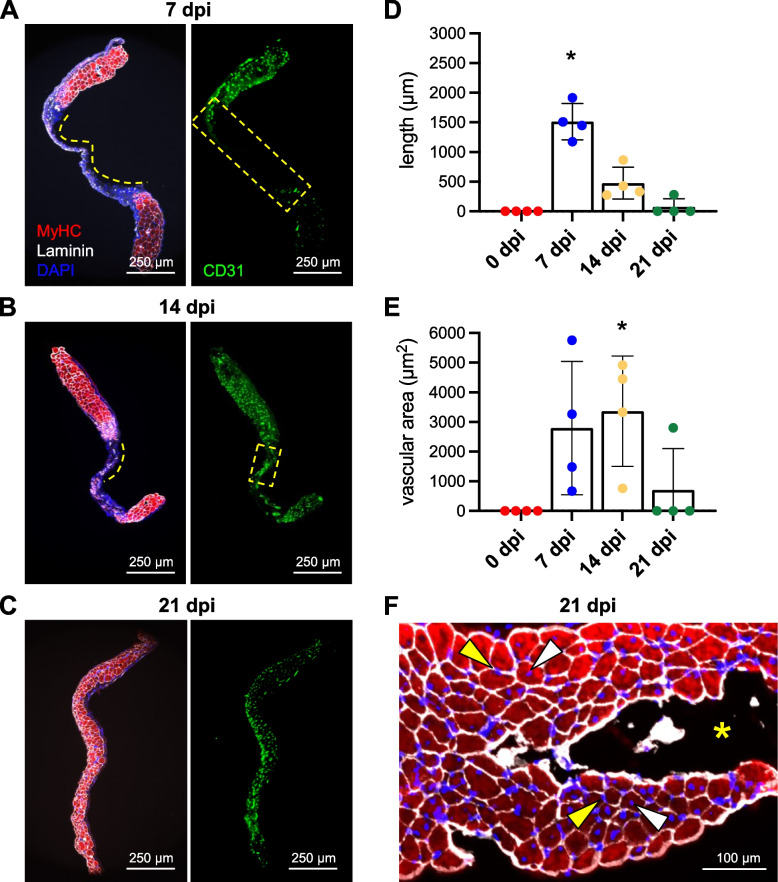
Fig. 5.
Angiogenesis precedes myogenesis during regeneration. Representative images of GM cross-sections from the center of the wound at A 7 dpi, B 14 dpi, and C 21 dpi. MyHC (myofibers): red; laminin (basal laminae): white; CD31 (ECs): green; DAPI (nuclei): blue. D Summary data for length of region devoid of myofibers (shown by broken yellow lines in A and B). E Vascular area within wound region devoid of myofibers (outlined by broken yellow rectangles in A and B). n = 4 per time point, *P < 0.05 vs 0 dpi. F Cross-section of from regenerated region within the wound at 21 dpi stained for laminin (white), MyHC (red), and myonuclei (blue). Some myofibers exhibit centrally located nuclei (white arrowheads) while others exhibit peripheral nuclei (yellow arrowheads). Yellow asterisk: region within biopsy where myofibers did not regenerate

