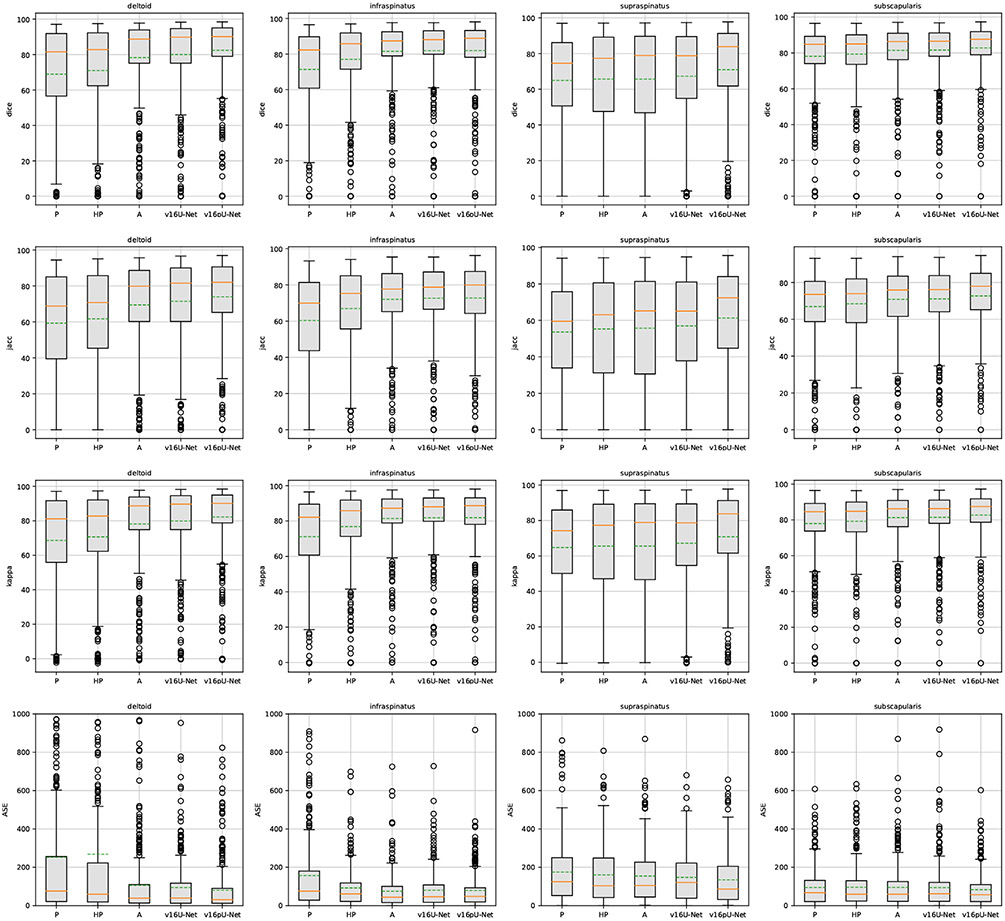
Fig. 4.
Box plots on Dice, Jaccard, Cohen’s kappa and absolute surface error (ASE) slice-wise scores over the pathological dataset using convolutional encoder-decoders (U-Net (Ronneberger et al., 2015), v16U-Net, v16pU-Net) embedded with learning schemes P, HP and A. Dashed green and solid orange lines respectively represent means and medians.

