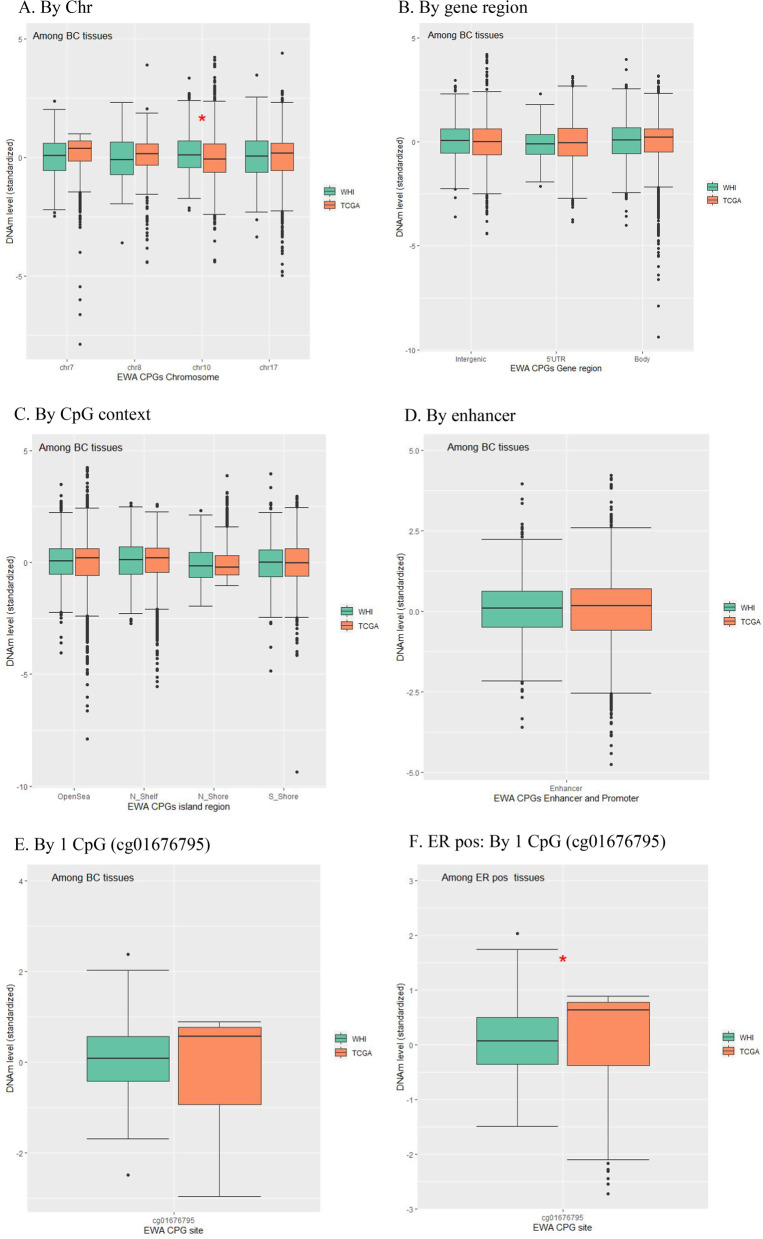
Fig. 3.
Box plots for DNAm levels from EWA IR-CpGs in association with BC, shared by BC datasets according to Chr, CpG context, and gene region. (BC Breast cancer, Chr Chromosome, CpG CpG dinucleotide, DNAm DNA methylation, ER pos Estrogen receptor/progesterone receptor–positive, EWA Epigenome-wide association, IR Insulin resistance, TCGA The Cancer Genomic Atlas, UTR Untranslated region, WHI Women’s Health Initiative. * Statistical significance after multiple-comparison correction). A By Chr; B By gene region; C By CpG context; D By enhancer; E By 1 CpG (cg01676795); F ER pos: By 1 CpG (cg01676795)

