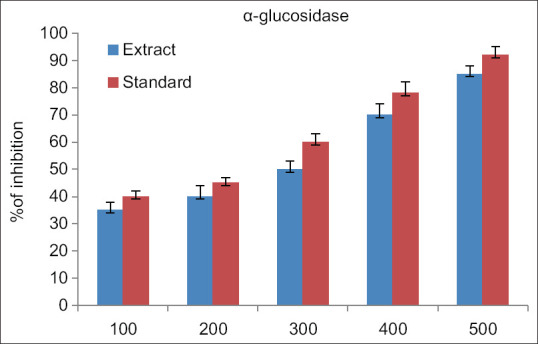
Figure 2.

Alpha glucosidase inhibitory activity of Kaempferia galanga extract. The above reference chart addresses the relationship between level of alpha glucosidase with ethanolic concentrates of KGR along with Acarbose. X pivot addresses the ethanolic concentrates of KGR and standard from 100 μg for every ml to 500 μg for each ml. The Y pivot addresses the rate of alpha glucosidase by both the concentrate and standard. The blue color denotes the KGR extract while the red color denotes the standard drug Acarbose. Every bar addresses the mean with SD for 3 observations. P < 0.05. SD: Standard deviation, KGR: Kaempferia galanga rhizome
