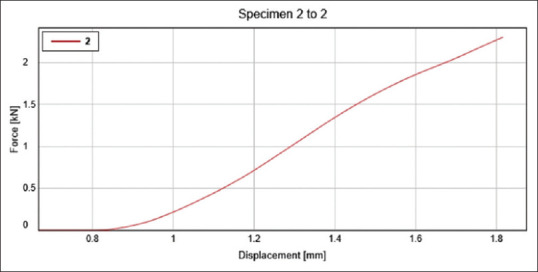
Figure 5.

It depicts the displacement of the test group- sample 1 at a given force. Where the y-axis depicts the Force (kN) and x-axis depicts the displacement (mm)

It depicts the displacement of the test group- sample 1 at a given force. Where the y-axis depicts the Force (kN) and x-axis depicts the displacement (mm)