Fig. 2.
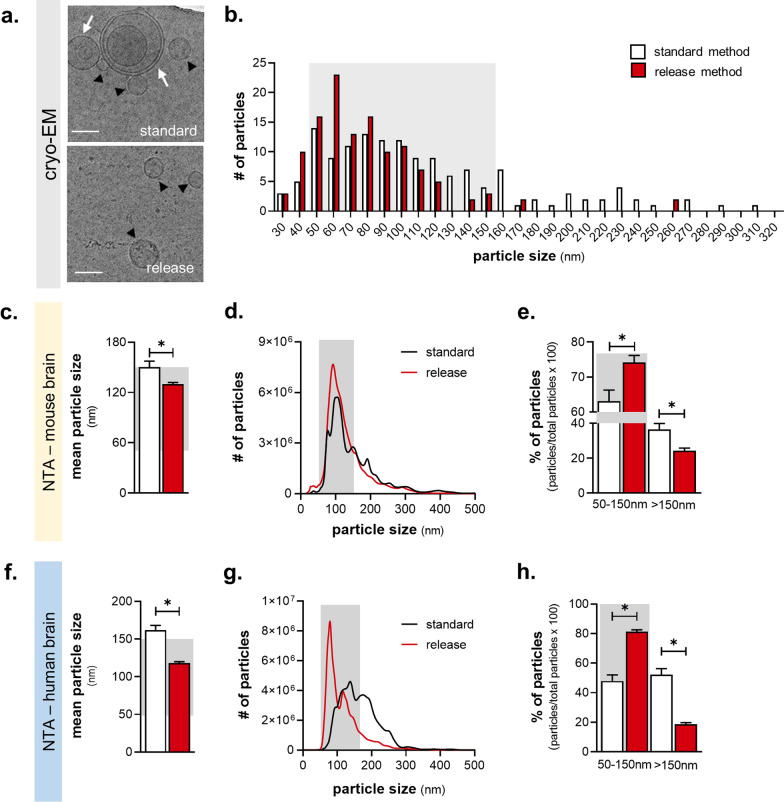
The release method provides higher purity small EV yield. a, b Cryo-EM micrographs (a) of isolated EVs (black arrowheads; multi-lamellar highlighted by white arrows; scale bar = 100 nm) and their size distribution (b) with grey region highlighting the size area of small EVs [50–150 nm]) (vesicles: Nstandard = 123, Nrelease = 144). c–h Nanoparticle tracking analysis (NTA) of the mean size (c, f) and size distribution (d, g) of particles from mouse and human cortex, respectively. Small EVs data are highlighted in the grey area (e, h) (mouse: Nstandard = 7, Nrelease = 8; human: Nstandard = 3, Nrelease = 3). All data shown represent mean ± SEM *p < 0.05 by two-tailed Welch’s t-test

