Fig. 4.
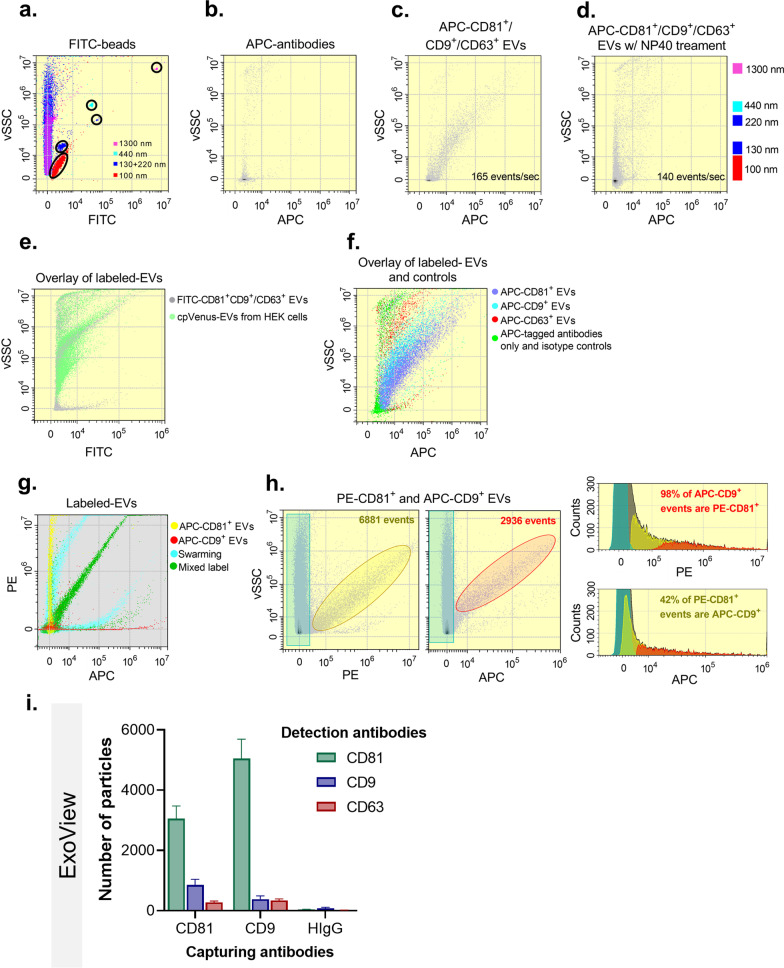
The release method enriches for subpopulation of small EVs. a Plot of size-specific events based on FITC-tagged beads (vSSC, size-related measurement). b Density and dot plots show the vSSC (size-related measurement) in function of the fluorescent signal representing positive events in samples APC-antibodies alone (b). c–e EVs simultaneously labeled with APC-tagged anti-CD81, -CD9, and/or CD63 antibodies in the absence (c) or presence of NP40 detergent (d) and overlayed EVs isolated from the conditioned media of cpVenus-HEK cells by ultracentrifugation (e). f Overlay of EVs individually labeled with the three APC-tagged antibodies and antibodies controls. g Representative overlay of PE vs. APC fluorescence signal of individually (PE-CD81, yellow; APC-CD9, red) or simultaneously (green) labeled EVs of the release method, as well as the swarming effect (turquoise). h Total number of events of simultaneously labeled EVs as a function of PE or APC fluorescence, respectively (turquoise gate: background; yellow gate: PE+ events; red gate: APC+ events). Relative abundance of gated events as a function of PE or APC fluorescence within total events (grey). i ExoView analysis of the number of positive particles for CD81 or CD9 (N = 3 samples)

