Fig. 2.
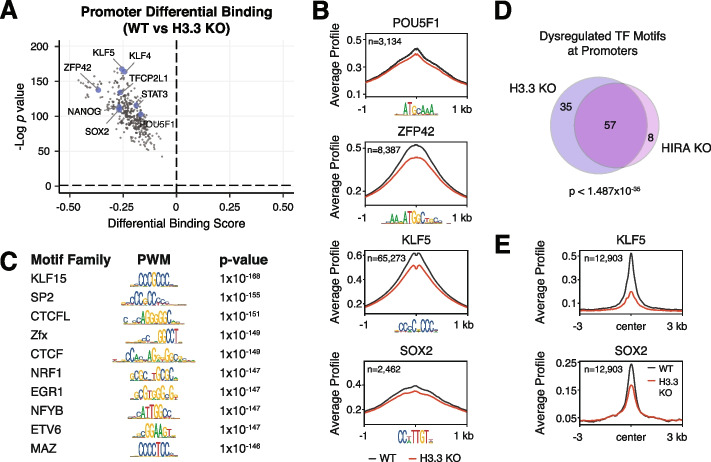
Loss of H3.3 reduces TF footprinting at promoters. A Pairwise comparison of TF activity at active promoters (n = 12,903) between WT and H3.3 KO ESCs. The volcano plot shows differential binding activity against the −log10(p-value) for all investigated TF motifs. Each TF is represented by a single circle (n = 395). TF motifs enriched in WT ESCs have negative differential binding scores and TF motifs enriched in H3.3 KO ESCs have positive differential binding scores. Motifs for a subset of pluripotency-associated TFs are highlighted in blue. B ATAC-seq average profiles at representative TF motifs at promoters in WT and H3.3 KO ESCs. Data are centered on the motif, and the number of motifs profiled is indicated. C Illustration of motifs of the most dysregulated TF families at promoters in H3.3 KO ESCs classified based on Manhattan scores in the top 10% across all comparisons (i.e., WT vs H3.3 KO, HIRA KO, ATRX KO, or DAXX KO). D Venn diagram representing TF motifs commonly dysregulated at promoters in H3.3 KO and HIRA KO ESCs based on Manhattan score as described above. E CUT&Tag average profiles of KLF5 (top) and SOX2 (bottom) enrichment at active promoters (n=12,903) in WT and H3.3 KO ESCs. Three kilobases around the center of promoters are displayed for each analysis

