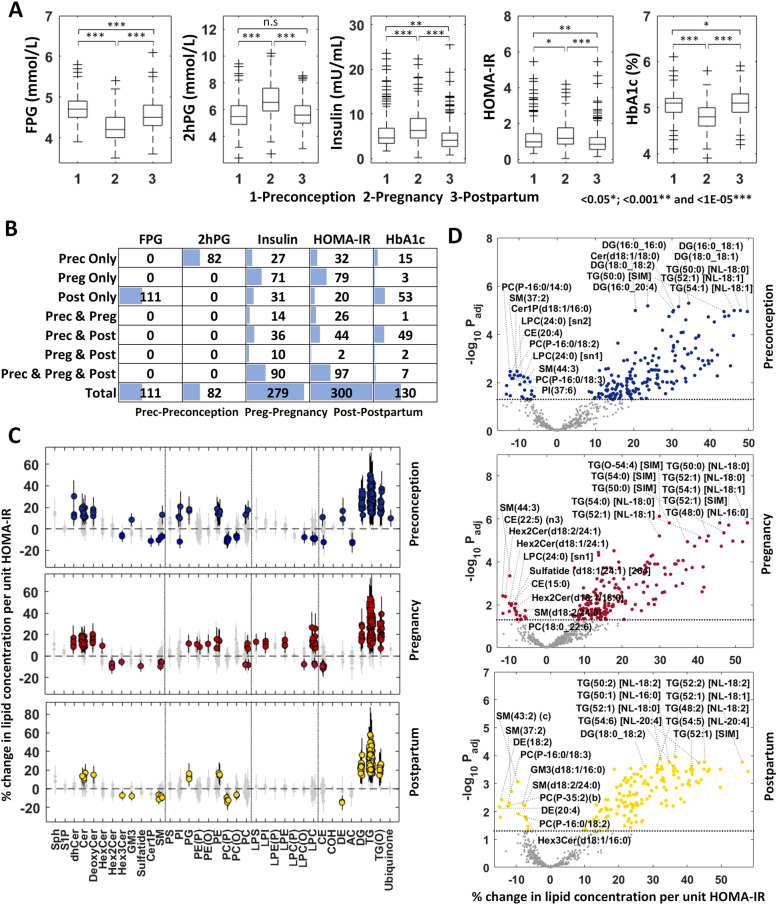
Fig. 5.
Association of measures of glucose homeostasis and insulin resistance with plasma lipidomic profiles at preconception, pregnancy and postpartum using trio subjects. A Box plots of fasting glucose (n = 249), 2-h post-load glucose (n = 226), fasting insulin (n = 243), HOMA-IR (n = 240) and HbA1c (n = 249) at three time points. The p-values are calculated by paired t-test. B Number of significant lipid species at three time points (Padj < 0.05). C, D Forest plots (error bar: 95% CI) and volcano plots of the HOMA-IR studies at three time points. Diamond—Padj ≥ 0.05 (grey), circle—Padj < 0.05 and square—Padj < 1.00E−5 in forest plots. Top 10 lipid species with positive and negative associations are labelled in (D). The horizontal dotted line in D indicates Padj = 0.05

