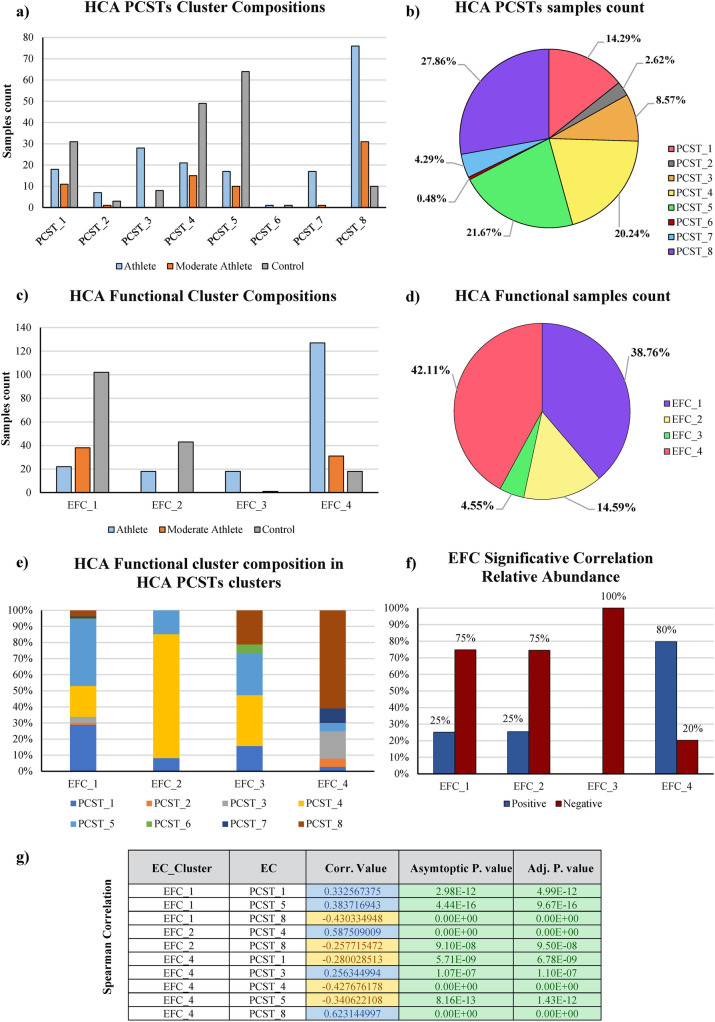
Fig. 1.
Samples subdivision between PCST and EFC clusters. In a, the PCST compositions in sample type (athlete, sedentary and moderate athlete) is reported, while in b, the total sample subdivision between the PCSTs is reported. Following the same logic, in c, the EFC compositions in samples type (athlete, sedentary, and moderate athlete) are reported, while in d, the total sample subdivision between the EFCs is reported. e The PCST distribution inside the EFC clusters. f The EFC correlation percentage with EC-Numbers. Finally, in g, the correlation score between EFCs and PCST clusters is reported

