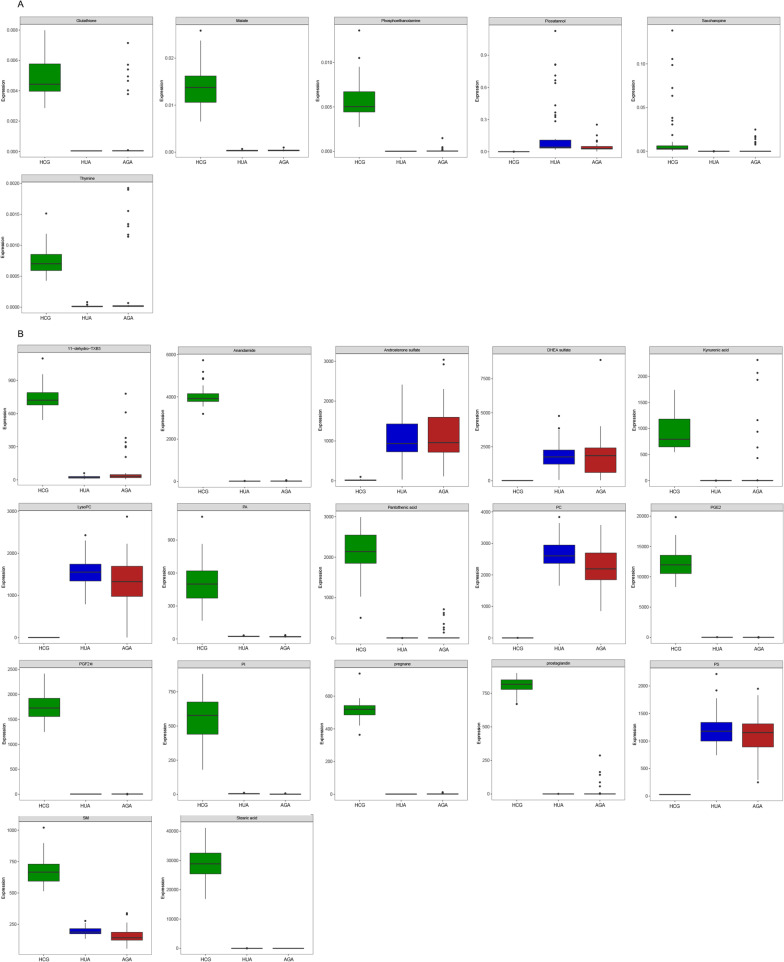
Fig. 3.
Box-and-whisker plots of selected potential biomarkers. A selected potential biomarkers were found by GC–MS. B selected potential biomarkers were found by LC–MS. The green box on the left represents the HCG, and the blue box on the middle represents the HUA, the red box on the right represents the AGA. Horizontal line in the middle portion of the box, median; bottom and top boundaries of boxes, lower and upper quartiles; whiskers, 5th and 95th percentiles. HCG: the healthy control group; HUA: asymptomatic hyperuricemia; AGA: acute gouty arthritis; LysoPC: lysophosphatidylcholine; PA: phosphatidic acid; PC: phosphatidylcholine; PGE2: Dinoprostone; PGF2α: Dinoprost; PI: phosphatidylinositol; PS: phosphatidylserine; SM: sphingomyelin

