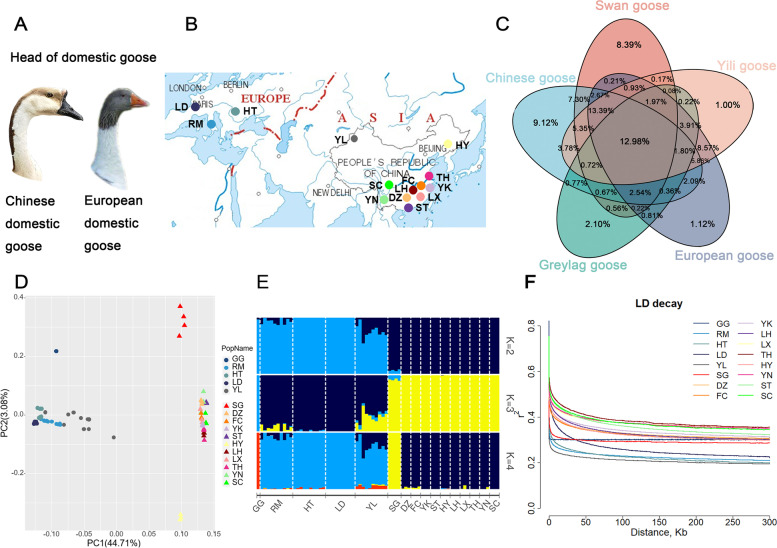
Fig. 1.
Experimental setup and population genetic structure. A Knob on head of domestic geese, the Chinese domestic goose is on the left, and the European domestic goose is on the right. B Location of the samples used for this study. A total of 74 geese, including swan geese (n = 4; origin, China), greylag goose (n = 1; origin, Europe), 11 Chinese goose breeds (n = 10 of YL; n = 3, each a different breed), and three European domestic goose breeds (n = 29) were used. See Additional file 1: Table S1. C Genomic SNPs of five populations. D PCA plot of geese breeds. E Population genetic structure of geese. The length of each colored segment represents the proportion of the individual genome from the ancestral populations (K = 2–4), population names are at the bottom. F LD decay patterns

