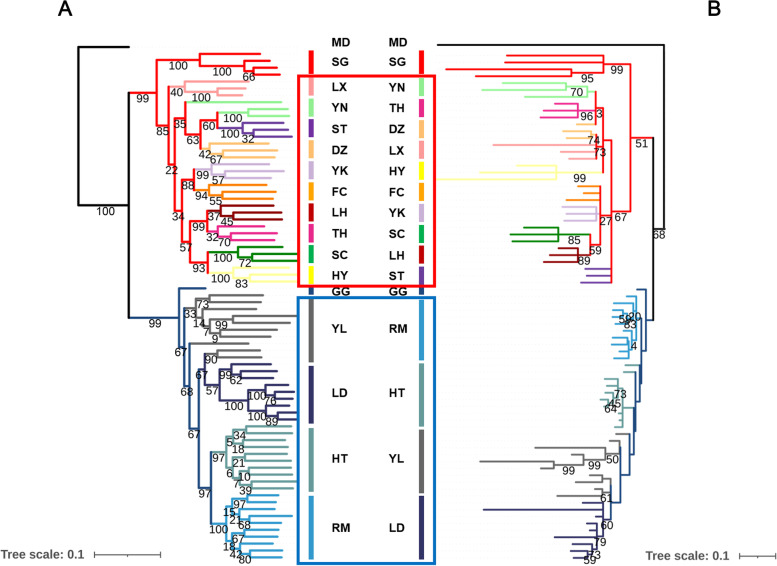
Fig. 2.
Maximum likelihood phylogenetic tree of the goose population, showing the two origins of domesticated geese. A Genome-wide phylogenetic tree. B Mitochondrial phylogenetic tree. The color of the branches indicated the different breeds of geese. The value on the branches indicated the bootstrap values. MD represents the mallard (Anas platyrhynchos), the outgroup used in the phylogenetic analysis. SG represents the swan geese, GG represents the greylag geese, the blue box indicates European domestic and Yili geese, and red box indicates Chinese domestic geese

