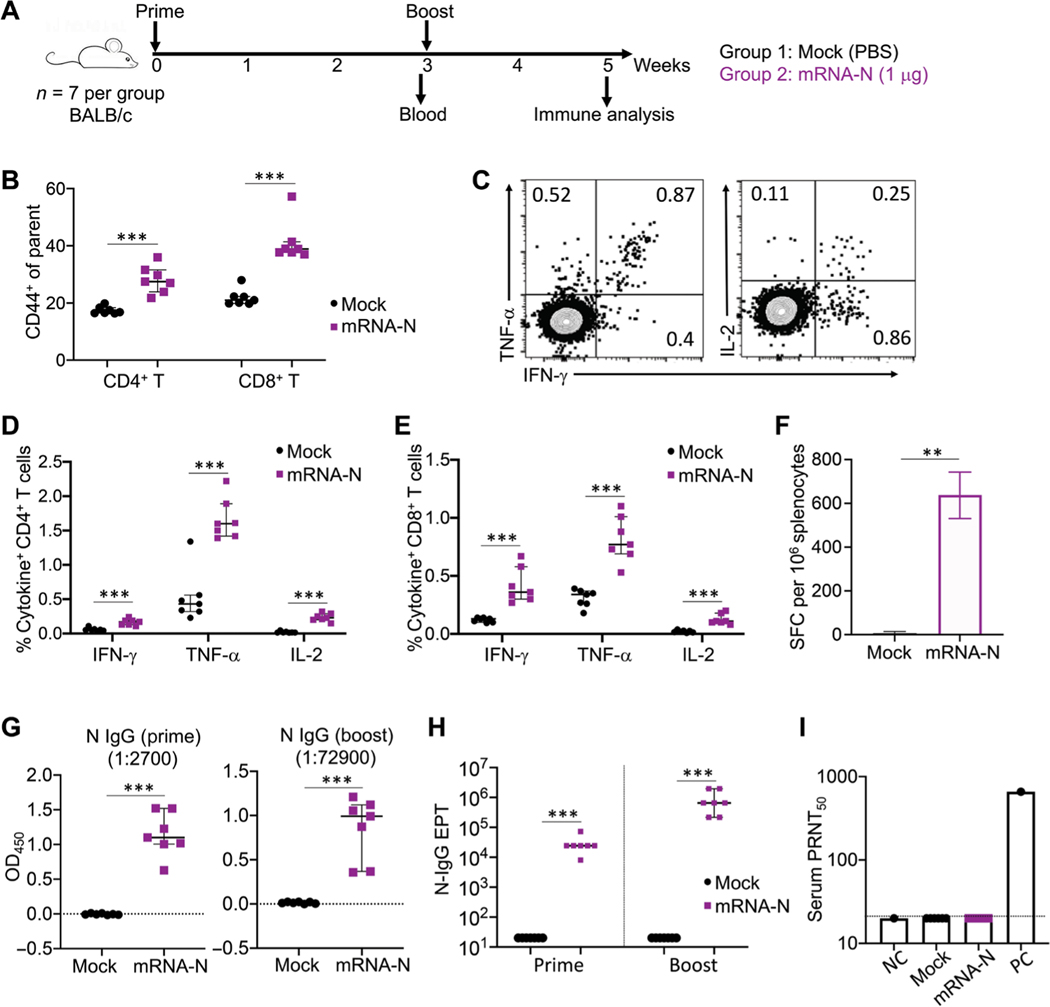
Fig. 1. mRNA-N vaccination is immunogenic in mice.
(A) Experimental design and timeline. Two groups of BALB/c mice (n = 7) were intramuscularly vaccinated with PBS (Mock) or mRNA-N vaccine (1 μg) at weeks 0 and 3. At week 3 before booster vaccination, blood and serum samples were collected for analysis of antibody response. Two weeks after booster vaccination (week 5), mice were euthanized and subjected to immune analysis. (B) Analysis of total CD4+ and CD8+ T cell activation in the mouse spleen at week 5 after immunization. Expression of CD44 on CD4+ and CD8+ T cells was examined by flow cytometry and shown as percent CD44+ of parental population. (C) Vaccine-specific T cells in mouse spleen were measured by ICS. Splenocytes were stimulated with a SARS-CoV-2 N peptide pool (QHD43423.2), followed by immune staining and flow cytometric analysis. Representative flow cytometry plots for cytokine expression in T cells are shown. (D) Shown is the comparison of percent cytokine-positive, N-specific CD4+ T cells in the spleen between mock and vaccine groups. (E) Shown is the comparison of percent cytokine-positive, N-specific CD8+ T cells in the spleen between mock and vaccine groups. (F) N-specific T cells in the spleen were measured by IFN-γ ELISPOT. Data were shown as SFC per 106 splenocytes. (G) ELISA measurements are shown for serum N-specific–binding IgG after prime (week 3) or booster (week 5) vaccination. Optical density (OD450) values for individual serum samples after prime or booster vaccination at indicated serum dilution (1:2700 for prime; 1:72900 for booster) are shown. (H) Comparison of N-specific IgG end point titers (EPT) between mock and vaccine groups after prime and booster vaccination is shown. (I) Serum neutralizing activity was measured by plaque reduction neutralization test (PRNT) using wild-type SARS-CoV-2. PRNT50 for individual serum samples of the mock and vaccine groups are shown. Dashed line in (I) indicates the limit of detection. NC, negative control; PC, positive control. Data are presented as median and IQR. Mann-Whitney (F to H) or Kruskal-Wallis (B to E) test was used for statistical analysis. **P < 0.01 and ***P < 0.001.

